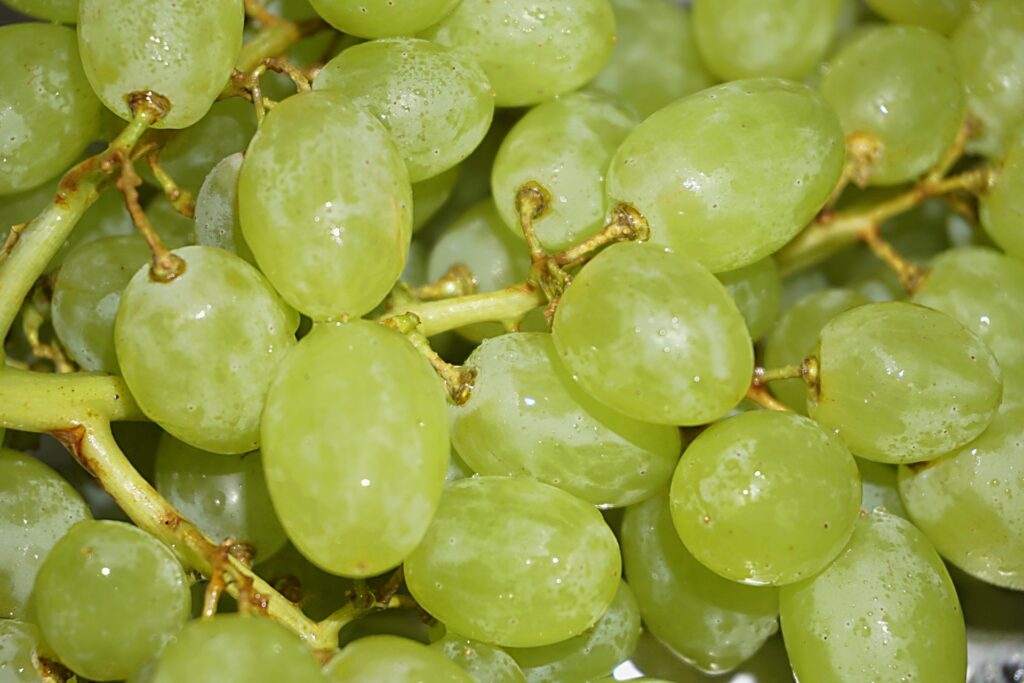
Some farmers do not pick grapes, squash them and then ferment the juice. Some farmers just sell them for eating. And why not? Grapes have long been the gift of choice for hospital visitors. The glucose sugar in grapes is absorbed quickly into the blood stream to provide a burst of energy for a sick patient. Table grapes are also a major global fruit crop, with almost 26 million metric tonnes being grown last year, 2020. Typically table grapes account for roughly one third of global grape production, less than 10% are grown for dried fruit and the bulk are grown for wine making.
It is logical then that table grape growers are becoming more and more interested in new precision viticulture technologies being adopted in winery vineyards. The key questions for farmers are: which technology to adopt? what are the benefits? how easy is it to use? These are the questions a group from the Agricultural University of Athens (AUA) have been keen to answer and they recently published their findings in a paper last month.
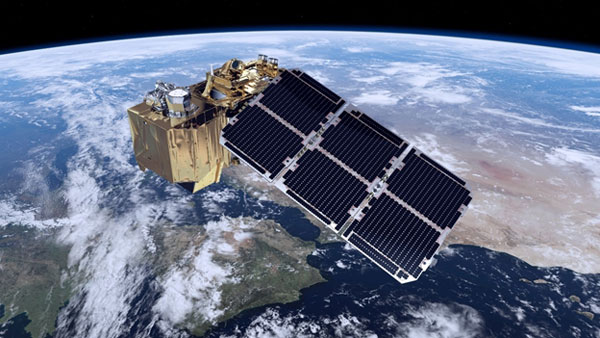
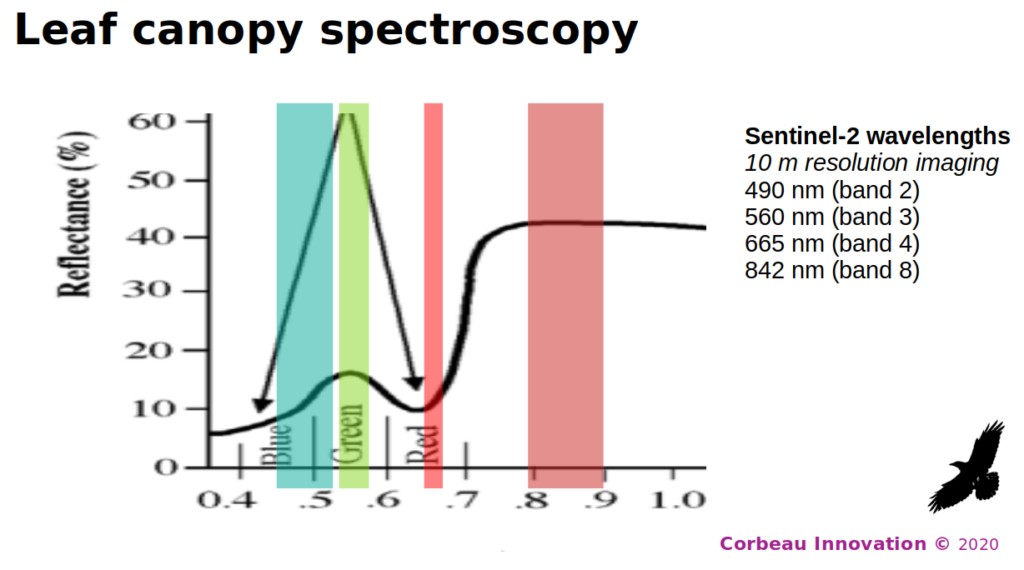
Emmanouil Psomiadis and his colleagues from AUA made a comparison of two common approaches to vineyard monitoring: remote (via satellite) and proximal (ground based) multispectral analysis of a table grape crop canopy. Multispectral analysis measures the amount of light of different wavelengths reflected by a crop. Whereas the human eye can only see three different colour bands (red, green and blue), imaging detectors like the Multi Spectral Instrument (MSI) on the European Sentinel-2 satellite have up to 13 bands from the violet end of the visible spectrum to the invisible infrared. Having more spectral bands offers the possibility of better resolution of different plant pigments like chlorophyll, xanthophyll and lycopene. More accurate measurement of plant chemistry can potentially be used to pick up early signs of disease and nutrient deficiencies.

The team from AUA were also interested to discover which of the many so-called Vegetation Indices (VIs) were the most useful. One of the features of satellite measurements of the earth surface is that the light on the ground is not always the same. It’s true that the sun’s output is pretty much constant but the angle of the sunlight falling on plants in a vineyard changes throughout the day and from season to season. The atmosphere tends to scatter blue and violet light more than red and infrared and therefore sunlight appears red in the evening and yellow in a clear sky at midday. Sunlight reflected back to an orbiting satellite from a vine canopy therefore changes from day to day.
Vegetation Indices, which are ratios of different spectral bands, were introduced to overcome these variations. Three of the most widely used are Normalise Difference Vegetation Index (NDVI), Normalised Difference Red Edge (NDRE) and Fraction of Absorbed Photosynthetically Active Radiation (FAPAR). Researchers have their own favourite VI but each tries to accurately determine the fraction of the ground covered by green vegetation within a particular image pixel.
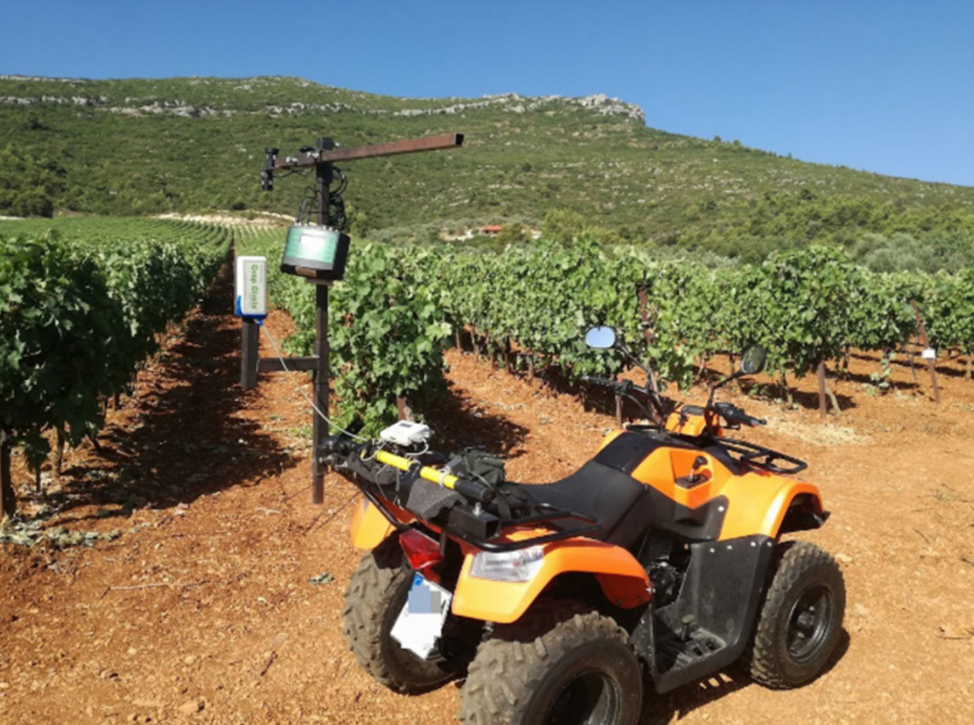
Measurements with proximal multispectral instruments have a number of advantages over satellite imaging. Handheld or tractor mounted instruments cannot cover the vast areas caught in a single frame by a satellite detector but they are never interrupted by cloud and they can be fitted with their own light sources. With a consistent light source and measuring just the vines, rather than the earth or cover crop between them, proximal multispectral imaging could offer better quality vegetation indices than satellites. The AUA group chose to use satellite data from the ESA Sentinel-2 satellite and proximal multispectral imaging from a Holland Scientific Crop Circle ACS-470 (see below mounted on a quad-bike).

(courtesy Agricultural University of Athens and Agronomy Journal)

To test the ability of both proximal and remote multispectral imaging to quantify grapevine vigour (as a VI), Psomiadis and colleagues chose a small vineyard near Corinth, Greece growing table grapes. They monitored the vineyard through the season, recording proximal multispectral data from vine canopies and downloading satellite images from the start of ripening (veraison) to the point of harvest. The best correlation between the two sources of spectral measurements was obtained with NDVI and FAPAR (Fraction of Absorbed Photosynthetically Active Radiation) indices.
NDVI = (Reflectivity(Near infrared) – Reflectivity(Red)) / (Reflectivity(Near infrared) + Reflectivity(Red))
Equation for calculating NDVI; the higher the ratio, the greener the canopy
Interestingly it was found that the best correlation (correlation >0.87) between proximal and remote measurements was at the later stages of grape ripening. Sentinel-2 satellite images have at best 10m spatial resolution therefore measurements earlier in the growing season, before the full development of the leaf canopy will include a bigger contribution from bare earth or a cover crop grown between the rows of vines.
Many more details about the vineyard studied and the calculation of different VI ratios can be found in the Agronomy journal paper. Importantly, the study has shown that multispectral measurement of vineyard vegetation indices using both remote and proximal technologies give consistent results.
The paper suggests three answers to the key questions from grape farmers:
- use either remote or proximal multispectral measurement, ideally both as they are complementary
- the key benefit demonstrated from the study is that plant vigour can be non-invasively quantified either with low resolution satellite imaging or higher resolution proximal measurement
- Sentinel-2 imagery is freely available but some knowledge is required to create the VI maps of a vineyard. Proximal measurement is quicker than traditional field walking but with GPS tracking it can be straightforward to relate VI ratios to vines
Read the full paper here.
Find out more about the ESA Sentinel-2 mission here.
Find out more about Corbeau’s own multispectral vineyard project.