Search for:
Finding rare earth elements by hyperspectral imaging
Rare earth elements (15 lanthanides plus Scandium and Yttrium)

Imagine a world without smart phones, the latest medical imaging or great bass response from your earphones? Nope, nor can I. Worryingly, the continued availability of these essential 21st century pieces of tech is far from certain because they each rely on so-called Rare Earth Elements (REEs). REEs are not particularly rare but they are rarely found in the earth at sufficiently high concentrations to make it commercially viable to mine them.

The vast majority (>90%) of the world’s supply of REEs comes from China; the USA and Australia producing most of the remainder. With the fast growing demand for REEs and the equally fast growing economic Cold War between China and the West, supply is looking precarious.

Historical REE production 1958 – 2008 (courtesy US Geological Survey)

In 2016 a detailed report was published by the European Union EURARE project. European geological survey groups from Finland to Greece reported rare earth elements were widely present across Europe but there were just a few potentially viable REE mines. The figure below shows the EURARE distribution of ‘belts’ of REE geology. The next step would be to send a geologist with her rock hammer out into the field and then drill cores to find exactly where viable concentrations of rare earth minerals could be mined. But how to examine these areas of hundreds of square miles of land?

Belts of potential European REE geology (image courtesy of Elsevier Ore Geology Reviews)

Researchers from the Helmholtz Institute in Freiberg in Germany believe they have found the answer. Rene Booysen and her colleagues reported this month that Unmanned Aerial Vehicles (UAVs) can be used to deploy hyperspectral imaging cameras to accurately locate REE deposits on the earth’s surface. Lanthanide minerals absorb light in very characteristic ways. Rather than absorbing broadly yellow light like a sapphire for example, the lanthanide REEs have very narrow absorption bands. Narrow bands are loved by spectroscopists because they can be much more easily picked out against backgrounds. Providentially, REEs tend to be found together and one lanthanide in particular, neodymium Nd (see the blog title image), absorbs light very strongly indeed in its narrow absorption bands.

Reflectance spectra from the surveyed area in Siilinjaervi Finland, showing narrow absorption peaks due largely to REE neodymium. Survey points contain increasing amounts of neodymium. (courtesy Nature Scientific Reports)

The Helmholtz Institute group cleverly exploited this fact by mounting a hyperspectral imaging camera on a drone and then rapidly covering 10,000 m2 areas of interest in Namibia and Finland. In addition to the hyperspectral camera on a copter drone, a small UAV plane was used for 3D imaging so that geometric corrections could be made to the images taken by the drone.

UAV plane (A) used to correct HSI images and copter drone (B) with HSI imaging camera (courtesy Nature Scientific Reports)

Areas in Finland and Namibia were pre-selected from geological regions rich in so-called carbonatites, rocks on the surface known to contain REE minerals.

Geological maps of Namibia (A) and Finland (B) showing locations of carbonatite rocks where REEs can often be found (courtesy Nature Scientific Reports)

Impressively, comparison of the HSI neodymium images with elemental analysis of rock samples from the survey sites in Namibia and Finland showed good agreement with concentrations of neodymium and other rare earth elements.

Further extensive surveying and mining in Europe will be required to establish what mineable reserves of essential REEs Europe holds. The team from Helmholtz Institute in Germany have nevertheless validated hyperspectral imaging as a major step towards securing the economic future of many key modern technologies.

Read the full Nature Scientific Report here.

The European EURARE report was published by Elsevier here.

More information on rare earth minerals and geology can be found at the American Geosciences Institute.

FFP3 face mask
Raman sets new levels for FFP3 mask efficiency
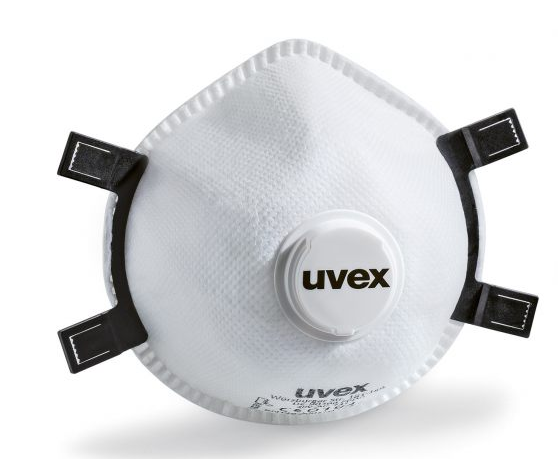
FFP3 rated respirator mask (from uvex safety (UK) Ltd)

Over the past three months we have all come to know more than we ever wanted to know about face masks. There was a time when most of us encountered face masks only as themes for movies (think Antonio Banderas in Zorro and Jim Carrey in The Mask) or as gloopy brown stuff applied to the face in an effort to recapture the glow of youth. Happy days.

Thanks to the coronavirus pandemic, face masks have become mandatory not only to protect workers in industry but also citizens walking the streets of many Western cities. Some are wearing surgical masks, others favour the N95 while yet more are re-fashioning old t-shirts like contestants in the Great British Sewing Bee. Personal Protective Equipment (PPE) comes in many shapes and sizes and today PPE is a hot topic.

For many years, the UK Health and Safety Executive (HSE) have established guidelines and requirements for the effectiveness of commercial face masks. It is crucially important that workers in hazardous dusty environments are safeguarded against ingesting particles that can get lodged in the lungs and cause discomfort in the short term and serious diseases in the longer term. Filtering Face Piece (FFP) masks are classified into three categories: FFP1 (>80% filtering), FFP2 (>95% filtering) and FFP3 (>98% filtering). Classification relies on practical testing of masks but the actual efficiency and effectiveness of a mask are determined by: materials and design; the fit to the face; and the methods available to test for very low levels of solid particles and aerosols.

Raman microscopy has recently been shown to offer a huge improvement in the Limit Of Detection (LOD) of particles actually inside a FFP3 mask. This matters for the most protecting respirators and for the detection of the smallest particles (10-200 nm) such as diesel exhaust soots and viruses. Earlier this month, researchers at the HSE and Sheffield Hallam University reported in the journal Analytical Methods that Raman microscopy improved the LOD of particles infiltrating an FFP3 mask from around 5.5 μg using conventional X-ray detection to 0.26 μg on similar sized test filters.

PVC membrane filters
PVC membrane filters (from SKC Ltd)

Chemical analysis of particles is tricky, as any analyst working on micro-plastics in water or airborne pollution will tell you. Peter Stacey and his group at HSE developed and carefully tested different particle sampling methods. PVC test filters were placed inside FFP3 masks fitted to breathing dummies, which were then exposed to air containing silica particles. Silica particles are an established cause of silicosis lung disease and are a good subject for analytical technique development.

FFRED respirator test demonstrator (from JSP Ltd)

PVC filters are convenient for sampling but silver filters give lower background signals for Raman microscopy and are already used for X-ray analysis. Therefore the particles were washed from the PVC filter and transferred to silver filters for final analysis. This step in the method offered the possibility to control the concentration of the collected particles on the surface prior to analysis. Taking up to 60 areas on the surface of the filters, the Raman method quickly gave a quantitative determination of the number of silica particles. As a technique that gives a molecular ‘fingerprint’ of the particles, Raman can also easily identify the kind of silica (quartz, cristobalite or amorphous), which is less easy with X-ray diffraction.

Silver filter
Silver membrane filter (from SKC Ltd)

Another future refinement of the technique could be the detection and identification of unknown particles by searching the Raman spectra of particles against a spectral database. Combining the advantages of novel materials, clever mask design and ever more sensitive analysis will make PPE more personal and more protecting in the future. New analytical technique development is playing its part in the fight against airborne pollution and disease.

The published article on the new Raman analytical method can be found at the Royal Society of Chemistry Analytical Methods .

You can see a short video of a FFP mask test demonstration here.

cracked smartphone
Gorilla glass under the (Raman) microscope
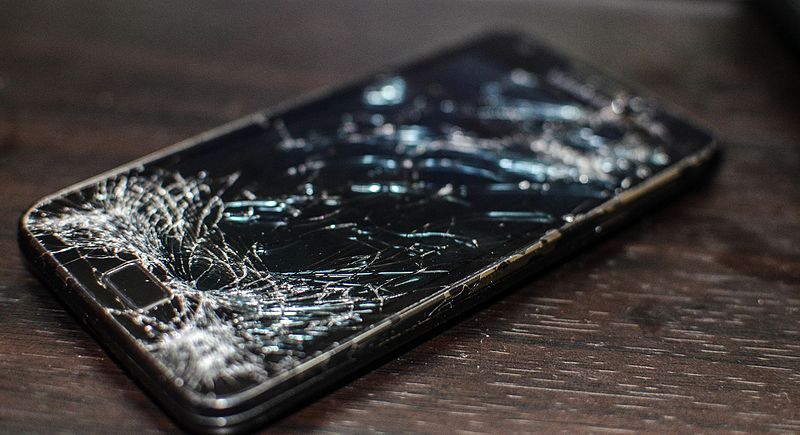
It’s happened to at least one of our smartphones or tablets. Our pride and joy piece of tech gets dented with an ugly crack or scratch. Smartphones are so essential to modern life that we stuff them into bulging pockets and handbags, not noticing what else we also can’t live without. Bunches of keys and coins don’t rub along too well with shiny glass surfaces. Happily advances in toughened glass chemistry are making these accidents less common.

smartphone glass
Cracked smartphone screen

A group from the Department of Applied Physics at Tohoku University in Japan recently reported a new way to study what makes the glass in our smartphones increasingly withstand everything our packed lives and handbags can throw at them. Writing in Nature Communications Physics, Professor Nobuaki Terakado described the valuable additional information that Raman microscopy gives glass technologists like Corning Inc. compared to existing materials characterisation methods.

Corning make the famous toughened Gorilla Glass that is found in an incredible 2 billion portable electronic devices. Gorilla Glass is much tougher than ordinary glass thanks to a clever surface modification that puts a compressive stress into a thin layer less than 50 microns thick. There is a cool video on the Corning website showing how the process works. Normal glass (like a wine glass or tumbler is made from) is a mixture of sand (sodium silicate) and boron trioxide. Corning glass used in smartphones contains aluminium oxide, making a harder and more resistant alumino-silicate glass. The really clever bit though is the surface modification step. At high temperature, the Corning glass surface is exposed to potassium ions in potassium oxide that swap places with sodium ions in the surface of the glass. When the glass cools down, the Gorilla Glass is left with a thin surface layer that has a residual compressive stress because the potassium ions are slightly bigger than the sodium ions in the rest of the material.

It is this stress that toughens the surface and makes it resist scratching and cracking. So stress is good, who knew?

Gorilla glass chemistry
Alkali ion (yellow) and silicate chains (blue/green/grey) in Gorilla Glass (courtesy Corning Inc)

Understanding what happens when the alumino-silicate molecules and the alkali (sodium Na/ potassium K) ions get swashed together is crucial to predicting the enhanced properties of Gorilla Glass. Terakado and his team have shown that Raman microscopy reveals changes in the bonding of the silicate molecules and the ions. Not only can you see the effect of the residual stress you can non-destructively see the changes in the chemical bonds in the material as a function of depth. They managed this by measuring changes in the Raman vibrational fingerprint in the surface layer compared to the bulk. Other materials characterisation techniques can measure the amounts of potassium in the glass but only vibrational Raman microscopy can reveal the way the molecules and ions are crucially bonded together to create incredible strength and resistance.

The recent Nature Communications Physics paper is available for download. Follow the link to find further reading on Corning Gorilla Glass 3. Cracked smartphone image : ( used with permission from https://commons.wikimedia.org/wiki/File:Samsung_Galaxy_S2_shattered_screen.jpg .