Coffee leaf miner infection located by multispectral imaging
espresso coffee
espresso coffee

There’s an awful lot of coffee in Brazil! according to the old song recorded by Frank Sinatra. In 2021 almost 70 million 60kg bags of coffee were produced in Brazil, roughly one third of global production, making Brazil the largest coffee producer in the world. Yield varies from year to year depending mainly on the weather but also on disease risks.

Coffee leaf miner infection is a major cause of poor cropping and ultimately plant death. These little critters are the larvae of a tiny moth that lays its eggs on the surface of coffee plant leaves. They munch their way into leaves leaving black holes filled with (ahem) poop, which create the impression of tiny mine shafts in the leaf.

Researchers at the Federal University of Lavras in Brazil have demonstrated a new way to spot the effects of disease in coffee plants using a drone equipped with a multispectral imaging camera.

coffee plant
Healthy coffee plant (courtesy WikiMedia Commons)

They flew the drone over a coffee plantation in the Minas Gerais region of Brazil. At a height of 3m it was possible to record images of individual coffee leaves on different Coffea arabica L. plants, images being taken with a multispectral camera. Four wavebands were used for the imaging: 530-570 nm  (green); 640-680 nm (red); 730-740 nm (red edge); and 770-810 nm (near infrared). Similar images were recorded manually of the leaves of healthy coffee plants of the same species in a greenhouse for comparison.

drone and multispectral camera
(a) Quadcopter drone and (b) multispectral camera used in plantation (courtesy AgriEngineering Journal and University of Lavras)

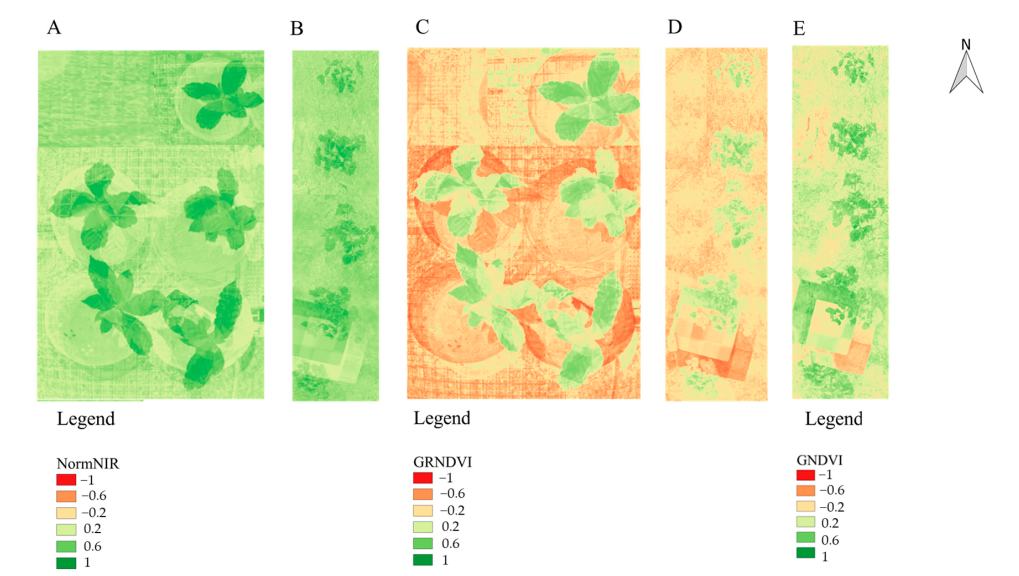
Images from any single camera waveband are subject to variations in sunlight and shadowing therefore researchers have developed a large number of different so-called Vegetation Indexes (VIs) to allow comparison of measurements on different days and at different locations. The normal method is to use a ratio of a camera waveband that changes a lot against a waveband that does not typically change very much. Possibly the most popular vegetation index is NDVI, Normalised Difference Vegetation Index:

NDVI = (NearInfrared – Red) / (NearInfrared + Red)

Plants absorb red and blue light strongly, reflecting green and near infrared therefore they have relatively high NDVI values (0.8-1.0). Basically the higher the NDVI value for a plant leaf, the greener and healthier it is. 

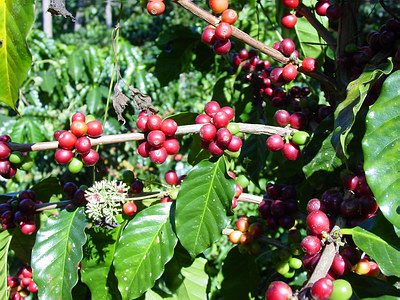
The team at Lavras wanted to discover which VI was the most effective at distinguishing healthy coffee leaves from leaves infected by coffee leaf miner. They reasoned that because infected leaves are generally darker due to the poop tracks, healthy  leaves should typically have higher VI values.

coffee plant vegetation index images
Coffee plant vegetation index images: (A, C) Healthy in greenhouse; (B, D, E) infected in plantation (courtesy AgriEngineering Journal and University of Lavras)

Comparison of the average difference in VI values and their distribution across many leaves showed that the GRNDVI index gave the best differentiation between healthy and diseased coffee leaves. Accounting for Green and Red variations between healthy and diseased leaves gave ratios of 0.32 and 0.06 for healthy and leaf miner infected leaves respectively. These values are lower than the NDVI values measured but give a much larger difference, allowing better differentiation.

Coffee farmers could benefit from quicker identification and location of leaf miner disease in their plantations if this research can be transferred to a commercial product. Coffee drinkers the world over could benefit from more sustainable farming and more stable pricing for their favourite brew.

Read the full journal paper here.

Find out about Vegetation Indexes here.

Find out more about coffee production in Brazil here.