CorbeauCast

solar_T_RH_sensor

CorbeauCast offers temperature forecasting based on machine learning. It provides vineyards with improved temperature forecasting. Trials have shown it is more accurate than the local Met Office forecast up to 70% of the time.

CorbeauCast also provides weekly summary charts of  temperatures, %RH, Growing Degree Days (GDD) and mildew At Risk Hours (ARH).

Use GDD to check anticipated phenological stages and how a season is progressing.

Use ARH when considering interventions against mildews.

CorbeauCast is suitable for weather stations from Davis, Ecowitt and Soil Moisture Sense Limited. CorbeauCast was developed and tested at Backyard-vineyard, Llanerch Vineyard and JoJo’s Vineyard (Russell’s Water, Henley-upon-Thames).

Latest microclimate report

2025 comparison

2025 comparison

Temperature forecasts

OpenWeatherMap forecast

CorbeauCast

Forecasts vs observations

OpenWeatherMap forecast
Weather station observation
CorbeauCast

Mildew advice

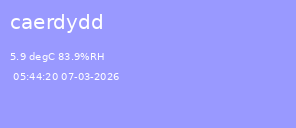
Powdery mildew and downy mildew are both important pathogens of grapevines and farmers typically spray sulphur and copper fungicides at 14 day intervals during the growing season. Conditions of high temperature and humidity encourage the growth and spread of mildews. CorbeauCast provides a daytime mildew risk indication of HIGH, MEDIUM and LOW. These correspond to vineyard conditions:

T>14 degC and RH >82%

T >14 degC and RH < 82%

T < 14 degC

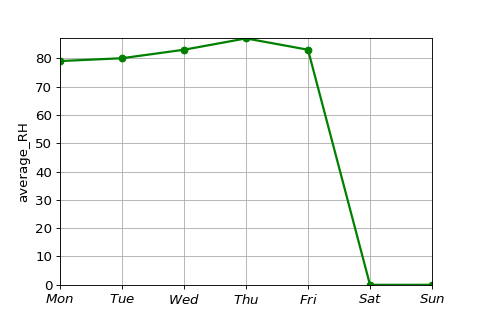
At times of HIGH mildew risk, it is important to check the At Risk Hours number frequently because it can accelerate rapidly.

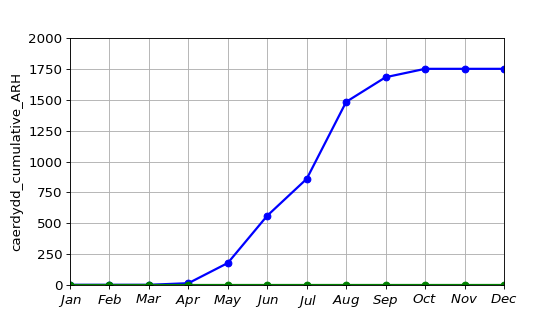
The At Risk Hours (ARH) chart provides a year-long record of accumulated mildew risk which can be considered when deciding on fungicide application. There are a number of potential intervention points:

75 hours – to tackle over-wintering spores

200 hours – to tackle mildew development

325 hours – to stop new mildew development

450 hours – to stop further mildew development and then every 125 hours if the season permits

Growing Degree Days advice

Growing Degree Days (GDD) is a useful record of how much energy a vine can potentially use to grow, flower, fruit and ripen. The GDD chart shows a cumulative total of GDD throughout the season.

It can be used to follow progress against expected phenological stages, alert to unexpectedly slow development and with a long-range weather forecast, to anticipate future stages.

Use the chart below to see how the vineyard or varietal parcels are progressing against expectations.