Search for:
malling centenary strawberry imaging
Smartphone spectral leaf imaging
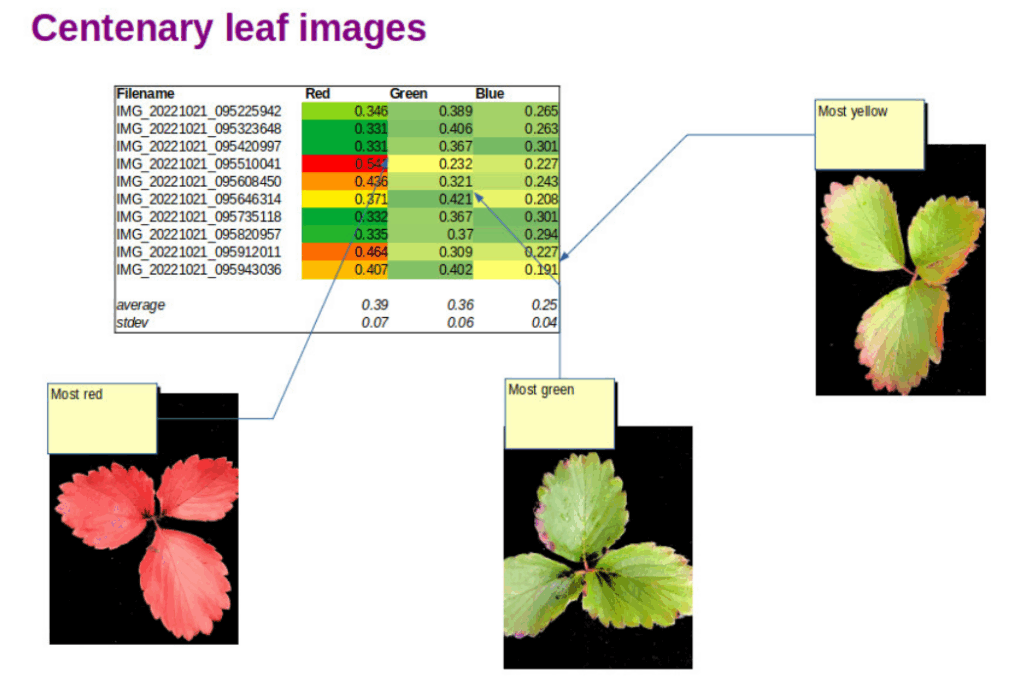
malling centenary strawberry imaging
Strawberry leaf images and Red Green Blue indices derived using OpenCV image analysis

All season we have been monitoring the health of our Strawberry Greenhouse crop. In addition to visual inspection with a loupe, digital leaf imaging has been a useful way to follow the development of the plants. Now that autumn has arrived, the leaves are showing the usual spectacular colour changes.

Chlorophyll green quickly gives way to yellowing and eventual reddening of the leaves. The yellow colour pigments are usually present in the leaves but as chlorophyll production is much less stimulated by sunshine, the yellow pigments can be seen. Red pigments are increasingly produced in leaves as the sugar concentration in the leaves increases. Leaf yellows are due to carotenoid pigments and leaf red colours are due to anthocyanin pigments.

Chlorophyll molecules absorb both red and blue light, leaving green visible light to be reflected by plant leaves, making them appear green. Carotenoid molecules  on the other hand absorb light in the blue end of the spectrum making leaves reflect and scatter yellow, green and red light. Anthocyanin molecules absorb blue and green light, making leaves reflect and scatter deeper red light.

leaf pigments spectra
Absorption spectra of chlorophyll a (blue), chlorophyll b (green), carotinoid type (orange), anthocyanin type (red) (Courtesy SPIE journals Creative Commons and Universidad de Guadalajara, Mexico)

Spectrometers and hyperspectral imaging devices can measure the colours of light reflected by leaves with high precision (1 nm or better). As the figure above from researchers at the Universidad de Guadalajara in Mexico shows, the light absorbed by plant pigments is absorbed in wavelength bands much wider than 1nm. Modern smartphones typically have cameras with many megapixels, giving images of astonishing resolution. The detector chips also have RGB elements capable of measuring red, green and blue light. The different red, green and blue pixels do not have high spectral resolution, their sensitivity curves are rather broad. However the red, green and blue sensitivity curves   are quite comparable to the widths of the absorption curves of the three main leaf pigments. The figure below shows typical spectral sensitivity curves for an Android phone.


Smartphone camera RGB sensitivities (Courtesy of Optical Society of America Open Access agreement)

Red camera pixels preferentially detect light attenuated by chlorophyll and green pixels preferentially detect light attenuated by anthocyanins. Blue pixels are not so discriminating, they detect light attenuated by chlorophyll, carotenoids and to a lesser extent anthocyanins.

It should therefore be possible to construct an index or set of indices which relates at least qualitatively to the amounts of leaf pigments in strawberry plant leaves. However this is not straightforward, the red channel is the only colour which measures the influence of just one pigment, chlorophyll. Red channel values cannot be simply used directly because lighting intensity varies during the course of a day and the sky and sun colours also change subtly. Changes in illumination (colours and intensity) can be normalised to some extent using a reference background for leaf imaging. A uniform black coloured background provides a useful contrast to the leaves themselves as well as a reference for red, green and blue intensities measured by the smartphone camera.

The figure at the top of this blog shows a spreadsheet with three normalised colour ratios:

R/(R+G+B); G/(R+G+B); B/(R+G+B)

Each index has a good relation to the redness/greenness/blueness of strawberry leaves growing in our Strawberry Greenhouse.

A short Python script was written to mask just the leaf pixels and sum the intensities of the red, green and blue pixel values for each leaf. Red, green and blue ratios were then calculated to give numbers independent of illumination intensity. One of the great things about using Python is the ease of programming and the large number of Python library modules freely available. Image analysis was carried out on JPG files using the OpenCV open source computer vision library.

Further work is ongoing to develop image models that reflect the presence of chlorophyll, carotene and anthocyanin pigments more specifically. Ultimately it may be possible to relate changes in pigmentation not only to senescence but also to nutrient levels and disease susceptibility.


Leaf spectroscopy research from the Universidad de Guadalajara in Mexico has been reported here.

OpenCV project library and documentation can be found here.

Read more about our Strawberry Greenhouse project here.

french bean leaves
Mineral deficiency in bean leaves classified by multispectral imaging
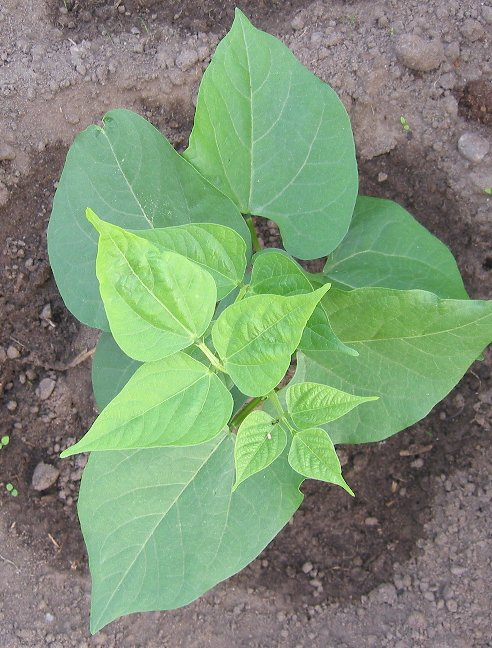
French bean Phaseolus Vulgaris (Image courtesy of WikiMedia Creative Commons)

Plants tell us when they are lacking vital nutrients but we can’t always hear what they are saying. Nitrogen, phosphorous and potassium (N, P, K) are well know macronutrients and the appearance of plants lacking any one of them is also well known. Plants lacking nitrogen have small leaves and stunted growth, those lacking phosphorous have poorly developed root systems and plants deficient in potassium fail to flower well.

Micronutrients, including magnesium, boron and iron (Mg, B and Fe) also affect the way plants grow and function but act together with N P and K in ways that can be complicated. This means that chemical analysis is required to identify which element is lacking and how much should be added to a growing crop or to a field before sowing seed. Quantifying the elements present in plant material is straightforward to do in the lab but time consuming. If analysis is prompted by how the plant looks to the eye, it is also too late to correct a nutrient problem. To be useful, micronutrient analysis must be carried out at an early stage in plant development.

Researchers from the Department of Plant Development at the University of Zagreb recently reported that multispectral imaging of plant leaves can be a quick, early and non-destructive way to classify nutrient deficiency in young bean plants. Writing in the latest edition of the journal Frontiers in Plant Science, Boris Lazarevic and team described how multispectral imaging of french bean leaves can be used to distiguish normal healthy plants from those lacking nitrogen, phosphorous, potassium, magnesium or iron. Just three days after introducing nutrient deficient conditions, multispectral imaging correctly classified 92% of bean plants suffering from deficiency. After twelve days, 100% of bean plants could be correctly classified as healthy or deficient in N P K Mg and Fe.

How did they achieve this?

CaBinet
PlantExplorer multispectral leaf imager (image courtesy of PhenoVation)

The team from Zagreb used an instrument similar to the PlantExplorer (shown above) to image juvenile leaves of french bean plants in containerised trays. Each tray contained plants growing in hydroponic media and was imaged at 3, 6, 9 and 12 days after the introduction of test solutions. A control solution with a cocktail of standard macro and micronutrients was the basis for the other nutrient deficient test solutions. Individual trays were grown with solutions lacking N, P, K, Mg and Fe components.

A phenotype or set of physical characteristics was used to identify potential changes in the leaves resulting from growing in solutions deficient in each mineral. These spectral parameters were either the reflectance of the leaves at different wavelengths (640, 550, 475, 510-590, 730, 769, 710 nm) or parameters (eg. green leaf index GLI, chlorophyll index CHI, anthocyanin index ARI, hue, saturation and intensity) derived from the images.

So far so good but how to extract useful information from the image data and how to evaluate the information? Lazarevic and team chose a statistical method known as linear discriminant analysis (LDA). LDA is a powerful way to use parameters or combinations of parameters that group together data from one set of plants and distinguish that set of plants from other sets of plants. In the case of the mineral deficiency study, the sets represented plants in each tray.

Decision tree for classification of plant leaf images based on multispectral parameters (Image courtesy of Frontiers in Plant Science Journal and the University of Zagreb)

The figure above shows how multispectral parameters were used to classify plant leaf images. Each three day timepoint is denoted by MT1, MT2, MT3, MT4. It is interesting to note that different discrimination criteria were used for different measurement dates. Different colours represent the different missing minerals. After 12 days, using LDA, it was possible to correctly classify virtually all the plant images into control, N P K Mg and Fe deficient groups. After just 3 days (MT1) most of the plant images were correctly classified but not with the same criteria as those used on other dates.

In addition to multispectral measurements on the plant trays, the Zagreb group also evaluated chlorophyll fluorescence and morphological measurements as potential techniques for mineral deficiency classification. Chlorophyll fluorescence is of interest because it can reveal levels of plant activitity or function. Morphological measurements, such as plant height, have long been used by farmers to check the progress of crops.

However neither method was as successful as multispectral imaging in classifying mineral deficiency. The paper from the Department of Plant Development at the University of Zagreb reveals that multispectral imaging can be used to classify different mineral deficiencies in plants. Consequences of mineral deficiency can be detected after only three days but the fact that each measurement date requires a different set of classification criteria suggests that the methods tested are not yet robust enough to use as generic measures of mineral deficiency.

It will be fascinating to see how far the multispectral imaging methods can be developed into routine diagnostic techniques for farmers.

The full Journal of Plant Science article can be found here.

Information about the BACO multispectral imaging instrument available from Corbeau Innovation can be found here.