Search for:
New Raman sensor for precision agriculture
Stressed basil plant

Sometimes stress can just creep up on you. Lack of sleep, lack of nutritious food and not drinking enough water have a cumulative effect. Yes, it’s a tough life being a basil plant. Happily precision agriculture techniques can now give early indication that crops are getting stressed. A new portable Raman sensor may help farmers to spot when plants need additional care and attention.

Researchers from the Disruptive & Sustainable Technologies for Agricultural Precision group, part of the Singapore-MIT Alliance for Research and Technology, recently reported an intriguing new method to measure plant nutrients non-invasively. Working at the Temasek Life Science Laboratory in Singapore in collaboration with colleagues at MIT in Massachusetts, they developed and tested a handheld Raman spectroscopy probe for plants. Their innovation was capable of measuring phytonutrients such as beta-carotene and lycopene and nitrate ions (a macronutrient).

Raman spectroscopy is a chemical analysis technique that produces a kind of fingerprint of the vibrations of molecules. Laser light of a single colour is focused onto the sample of interest and light scattered by the sample is collected with a lens or mirror. Virtually all of the light is scattered with the same energy as the laser but something like 1 in a billion of the laser photons is scattered with less energy. The energy difference between the laser and the scattered light corresponds to the energy of a vibration of the molecule. Heavy molecules vibrate slowly, light ones more quickly and large molecules have many different vibrations while simple molecules like oxygen O2 have just one. When the scattered light is dispersed by a prism or grating, the scattered light is separated into a spectrum. Different vibrations of molecules can be identified by the ‘fingerprint’ spots of light in the spectrum.

Raman spectra of five plant leaves, simple nitrate nutrients and four carotenoid phytonutrients (courtesy Nature Scientific Reports)

As the figure above shows, small nitrate molecules have simple spectra with few vibrations but bigger molecules like the carotenoids lycopene, neoxanthin and beta-carotene have many more vibrational Raman peaks. The Singapore-MIT team recorded Raman spectra from the leaves of six different leaf vegetables: arabidopsis, spinach, Pak Choi, Choy Sum, lettuce and Kailan. The spectra of the leafy vegetables look very similar because the leaves are made from similar components (typically lignin, cellulose, pectin and carotenoid) giving the plant cell walls structure and internal colour.

Raman plant probe comprising: an optical fibre probe for laser excitation and Raman collection and magnetic leaf holder (courtesy Nature Scientific Reports)

Surprisingly, the probe was sufficiently sensitive to detect nitrate ions in the water in the leaves. Using a prototype Raman leaf probe, the team compared hydroponic plant growth with sufficient nitrate and with insufficient nitrate. Signal levels were not as good as those of a laboratory Raman instrument but taking a ratio of the 1046 cm-1 nitrate peak and a nearby 1067 cm-1 peak as a comparison, consistently lower ratios of nitrate were seen in the stressed, nitrogen deficient plants. The figure below compares nitrate starved arabidopsis plants with unstressed controls.

Clear differentiation between nitrate starved arabidopsis plants (-N) and control plants (+N) (courtesy Nature Scientific Reports)

Using a different salad plant, Choy Sum, the handheld Raman probe was able to categorise temperature and drought stress. This time a more sophisticated chemometric technique was used to reveal differences between the three groups of plants.

Raman probe measurement of stressed Choy Sum and control plants, showing small but clear spectral differences (courtesy Nature Scientific Reports)

The photographs show that the plants are starting to wilt due to the lack of water and raised temperature. Less obviously, principal component analysis (PCA) of the Raman spectra was able to categorise the plants into three clusters corresponding to control, drought stressed and temperature stressed conditions.

Chemometric classification of stressed Choy Sum plants (courtesy Nature Scientific Reports)

The Singapore-MIT team have reported a fascinating new method of detecting stress in a number of salad crop plants. They developed an innovative Raman leaf probe instrument and combined with detailed analysis of the spectral data, have an encouraging proof of principle. Further development is required to demonstrate earlier detection of crop stress. Basil plants can look forward to a more relaxed, less stressed future.

Read the recent Nature Scientific Report here. The Singapore-MIT have published additional work on measuring N, P, K nutrients in plants and a convincing genotype study of nitrate uptake in Arabidopsis.

[ratemypost]

raman DMD blood test
New blood test for Duchenne Muscular Dystrophy
Raman DMD blood test
Duchenne model and control responses (courtesy of Nature Scientific Reports)

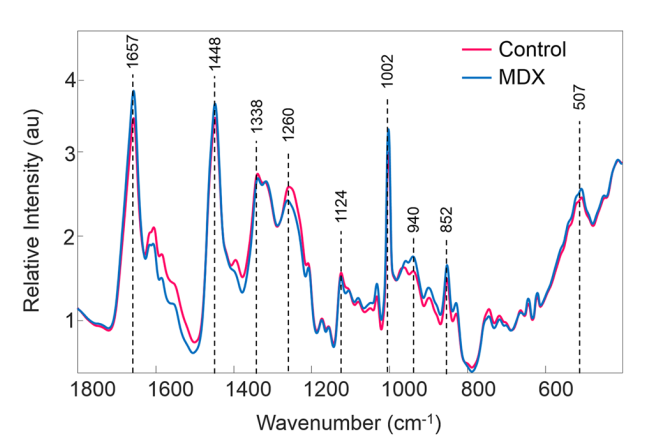
Duchenne Muscular Dystrophy (DMD) affects almost exclusively boys and there are around 2,500 people with the disease in the UK. It develops rapidly from around age 4 and is a life-limiting condition, with muscle tissue gradually degrading until it becomes lifeless. Life expectancy is typically 26 years. As a rare disease, research into DMD is not widely funded but research is also held back by the lack of a quick, definitive blood test. Such a test would permit studies to start at an early stage and allow treatment to slow the progression of the disease to start earlier too.

This month, researchers at the University at Albany in New York reported development of a new blood test for DMD. Writing in Nature Scientific Reports, they validated the test in so-called mdx mice (which have the disease). Encouragingly, they gave a measurably different response to healthy control mice.

The usual way to diagnose DMD is with a muscle biopsy. Even with stained tissues, it can be difficult to tell the difference between healthy and diseased samples. White fatty regions can be fairly easily seen in 12 months old mice but at 3 months, differences are not so obvious.

Muscle biopsies from healthy mice (A and C) and mdx mice (B and D). A & B at 3 months; C & D at 12 months (courtesy of Nature Scientific Reports)

Principal Investigator Professor Bijan Dey and his team took blood samples from the diseased and healthy mice, separating the blood plasma from the red blood cells and other components in the blood. Drops of blood plasma were allowed to dry and then multiple points on the residues were analysed with a Raman microscope.

Laser Raman microscopy is a non-destructive analysis technique that gives a ‘finger-print’ of the vibrations of molecules in a sample under analysis. Large molecules have many vibrations and give complex Raman finger-prints, while small molecules have just a few and give simple finger-prints. Heavy molecules vibrate at low frequencies whereas light molecules vibrate at high frequencies. The finger-print is a spectrum of these Raman vibrations, from low frequencies to high frequencies.

The figure at the top of this blog shows the subtle differences the Albany team found between blood from the healthy mice group (in red) and the diseased mice group (in blue). Looks easy to imagine how measuring at just a few points in the spectrum would give a simple test doesn’t it?

Actually it involved quite a bit more work. The figure shows averages of all the blood samples used in the test and the differences between individual tests were not always obvious. To find a way around the variation in the data in each group the researchers used a statistical method known as PLS-DA (Partial Least Squares – Discriminant Analysis). This mathematical method allows just the parts of the finger-prints that change the most to be used to classify a blood sample as either diseased or normal. Half the blood samples were used to devise a PLS-DA classification model which was then applied to the remainder.

Discrimination of blood samples from healthy and diseased mice (courtesy of Nature Scientific Reports)

Plotting three discriminating variables (LV1, LV2 and LV3) derived from the PLS-DA model, the figure above shows how the two clusters of blood sample results are clearly separated.

There is still much to do to fully validate the new Raman blood test for DMD. mdx mice are a widely model for Duchenne Muscular Dystrophy but further work is necessary to extend these promising results to patients.

Further information about Duchenne Muscular Dystrophy can be found at the National Organization for Rare Disorders. The Nature Scientific Report can be downloaded here.

ice bucket challenge
Non-invasive Raman diagnostic for neurodegenerative diseases shows promise
ALS Ice Bucket Challenge from 2014 (courtesy wikimedia commons)

Most people will remember the Ice Bucket Challenge better than its purpose, to fund a cure for amylotrophic lateral sclerosis (ALS). ALS is a neurodegenerative disease, also known as motor neuron disease. Brain diseases can produce confusingly similar symptoms in the early stages therefore a non-invasive, discriminating test would be hugely beneficial to treatment and research. Scientists in Milan recently reported a convenient new way to potentially detect and monitor the progression of the ALS based on the Raman spectroscopy of saliva rather than an invasive biopsy.

ALS has a range of initial symptoms ranging from difficulty swallowing to muscle weakness in the arms and legs and muscle twitching. These are caused by increasing failure of voluntary muscle control. In the final stages of the disease patients may require mechanical ventilation to breath and may only be able to communicate by eye movements.

Eventually symptomatic tests diagnose ALS and differentiate the condition from other neurodegenerative diseases such as Parkinson’s Disease (PD) or Alzheimer’s Disease (AD). Unfortunately such tests make early diagnosis and potential treatment impossible. Spinal fluid analysis is used to identify ALS but this is invasive and carries some risks to the patient.

In a recent publication in Nature Scientific Reports a team from the University of Milan, Italy reported the development of a saliva test for ALS. A saliva test for any disease is immediately attractive due to its non-invasive nature and potential for simple repeat testing. The report describes method development and application to three patient groups and a control group. The four groups comprised ALS (19 individuals), PD (10 individuals), AD (10 individuals) plus 10 control individuals with none of these diseases. Patients in the study groups were initially diagnosed using established benchmark tests. The goal of the Milan team was to establish reliable methods and protocols to obtain characteristic molecular fingerprints of components in the saliva and examine these fingerprints to look for subtle but significant differences between the four patient groups.

The Milan team found that saliva samples dried onto aluminium substrates produced the best results but that the saliva samples themselves had to be stripped of high molecular weight components that inhibited the detection of the molecules of most interest. Raman spectroscopy gives a fingerprint of the vibrations of molecules, which means spectra typically contain a lot of information. Unfortunately it usually has low sensitivity unless an enhancing agent such as silver or gold nanoparticles are used to increase the size of the Raman signal many thousands of times. The Milan groups discovered that the nanoparticles they used to enhance the Raman signal were inhibited by the non-distinct high weight components. Following a key innovative step, when these were filtered out, the Raman spectra of the purified saliva samples yielded much more information.

With informative datasets, the Milan spectroscopists set about analysing the results. A statistical method known as Principal Component Analysis (PCA) was used to pick out similarities and differences in the saliva sample spectra from the 49 study participants. The mathematical method takes no account of the spectroscopy, the molecules in the samples or the patients in the study. PCA is essentially blind to the expertise of the scientists and the identity of the patients but finds a number of spectra-like components that when added together in simple linear combinations can represent the spectra of each and any Raman spectrum of saliva from the 49 study participants.

What they found was that the relative proportions of three Principal Components PC1, PC2 and PC3 clustered more or less into four groups. These four groups were the saliva samples from ALS, PD, AD and control participants.

(courtesy Nature Scientific Reports)

The Milan team have developed a useful Raman assay protocol that can distinguish saliva samples from ALS patients from other patients with neurodegenerative diseases and healthy individuals. The method needs to be validated in larger studies and applied to longitudinal projects but the University of Milan have innovated a promising tool for disease research and treatment evaluation.

The full Nature Scientific Report can be found here.

Time magazine has a reminder of the Ice Bucket Challenge phenomenon.

FFP3 face mask
Raman sets new levels for FFP3 mask efficiency
FFP3 rated respirator mask (from uvex safety (UK) Ltd)

Over the past three months we have all come to know more than we ever wanted to know about face masks. There was a time when most of us encountered face masks only as themes for movies (think Antonio Banderas in Zorro and Jim Carrey in The Mask) or as gloopy brown stuff applied to the face in an effort to recapture the glow of youth. Happy days.

Thanks to the coronavirus pandemic, face masks have become mandatory not only to protect workers in industry but also citizens walking the streets of many Western cities. Some are wearing surgical masks, others favour the N95 while yet more are re-fashioning old t-shirts like contestants in the Great British Sewing Bee. Personal Protective Equipment (PPE) comes in many shapes and sizes and today PPE is a hot topic.

For many years, the UK Health and Safety Executive (HSE) have established guidelines and requirements for the effectiveness of commercial face masks. It is crucially important that workers in hazardous dusty environments are safeguarded against ingesting particles that can get lodged in the lungs and cause discomfort in the short term and serious diseases in the longer term. Filtering Face Piece (FFP) masks are classified into three categories: FFP1 (>80% filtering), FFP2 (>95% filtering) and FFP3 (>98% filtering). Classification relies on practical testing of masks but the actual efficiency and effectiveness of a mask are determined by: materials and design; the fit to the face; and the methods available to test for very low levels of solid particles and aerosols.

Raman microscopy has recently been shown to offer a huge improvement in the Limit Of Detection (LOD) of particles actually inside a FFP3 mask. This matters for the most protecting respirators and for the detection of the smallest particles (10-200 nm) such as diesel exhaust soots and viruses. Earlier this month, researchers at the HSE and Sheffield Hallam University reported in the journal Analytical Methods that Raman microscopy improved the LOD of particles infiltrating an FFP3 mask from around 5.5 μg using conventional X-ray detection to 0.26 μg on similar sized test filters.

PVC membrane filters
PVC membrane filters (from SKC Ltd)

Chemical analysis of particles is tricky, as any analyst working on micro-plastics in water or airborne pollution will tell you. Peter Stacey and his group at HSE developed and carefully tested different particle sampling methods. PVC test filters were placed inside FFP3 masks fitted to breathing dummies, which were then exposed to air containing silica particles. Silica particles are an established cause of silicosis lung disease and are a good subject for analytical technique development.

FFRED respirator test demonstrator (from JSP Ltd)

PVC filters are convenient for sampling but silver filters give lower background signals for Raman microscopy and are already used for X-ray analysis. Therefore the particles were washed from the PVC filter and transferred to silver filters for final analysis. This step in the method offered the possibility to control the concentration of the collected particles on the surface prior to analysis. Taking up to 60 areas on the surface of the filters, the Raman method quickly gave a quantitative determination of the number of silica particles. As a technique that gives a molecular ‘fingerprint’ of the particles, Raman can also easily identify the kind of silica (quartz, cristobalite or amorphous), which is less easy with X-ray diffraction.

Silver filter
Silver membrane filter (from SKC Ltd)

Another future refinement of the technique could be the detection and identification of unknown particles by searching the Raman spectra of particles against a spectral database. Combining the advantages of novel materials, clever mask design and ever more sensitive analysis will make PPE more personal and more protecting in the future. New analytical technique development is playing its part in the fight against airborne pollution and disease.

The published article on the new Raman analytical method can be found at the Royal Society of Chemistry Analytical Methods .

You can see a short video of a FFP mask test demonstration here.

Cutting edge: Raman directed cancer surgery

Successful cancer surgery depends crucially on accurate removal of all the cancerous material. This can be tricky in cases where the tumor has invaded healthy tissue with its crabby legs and pincers. Simply erring on the safe side and removing large amounts of surrounding tissue isn’t always a good solution because this can affect the functioning of adjacent tissue.

raman cancer cell molecular probe
Cancer cell molecular Raman probe (by Dept Neurosurgery, Fudan University from Chemical Science Journal)

Avoiding unnecessary damage to healthy tissue surrounding a tumor in the brain is particularly important. It is also particularly difficult because the human brain has upwards of 85 billion nerve cells and something like a million billion interconnections. There are however some tell-tale signs to help guide surgery. It has been known for some years that tumor cells are frequently more acidic than normal healthy cells and this month a group from the Fudan University in Shanghai reported a novel way to guide the removal of brain tumor cells based on the fact they are more acidic than normal cells.

Writing in the journal Chemical Science Ying Mao, Xiao Yong Zhang and Cong Li describe how they designed a molecular probe that selectively reveals differences in acidity and used it to guide the removal of rat brain tumors. Importantly, surgery guided by the use of the molecular probe during the operation gave more complete removal of the tumor compared to standard pre-operative MRI imaging and with less removal of healthy tissue compared to use of a control dye probe during surgery.

They synthesised special dye molecules and attached them to gold nanoparticles, which made them easy to detect using a technique known as surface-enhanced resonance Raman scattering (SERRS). Normally Raman scattering gives scientists a very weak signal but when attached to the gold particles the light emitted by the probe molecules increased millions of times.

The Fudan group call their new cancer probe AuS-IR7p. Au refers to the coupling to gold nanoparticles; IR7 refers to the fact the dye is excited with near infrared light (which penetrates tissue much better than shorter wavelengths); and the p stands for the fact that when the dye is in an acidic environment (protonated) it apparently changes its orientation on the gold nanoparticle which changes the relative intensity of two of the characteristic peaks in the Raman spectrum. This proved very useful because taking the ratio of the two peaks gave a measure of the acidity of the brain tissue that was independent of dye concentration and overall fluorescence intensity.

Conventional fluorescent dye staining to reveal acidic boundaries (in red) around tumor cells (by N. Rohani from MIT News / March 2019)

The neurosurgery project at Fudan University used a classic approach to innovation. While the acidic nature of cancer cells was well-known, it was only last year that the Koch Institute at MIT reported the detection of tumor cell boundaries using fluorescent dye. Putting together new information from an established area of need and novel solutions to problems using existing dye probes they have developed a potentially valuable innovation.

It remains to be seen if further studies confirm the advantages of Raman directed brain surgery but as a case study in innovation it makes fascinating reading.

The original Chemical Science journal article published by the Royal Society of Chemistry can be found here. Additional experimental details can be found here. Background on the MIT group research can be found here and the literature paper is published in Cancer Research.

cracked smartphone
Gorilla glass under the (Raman) microscope

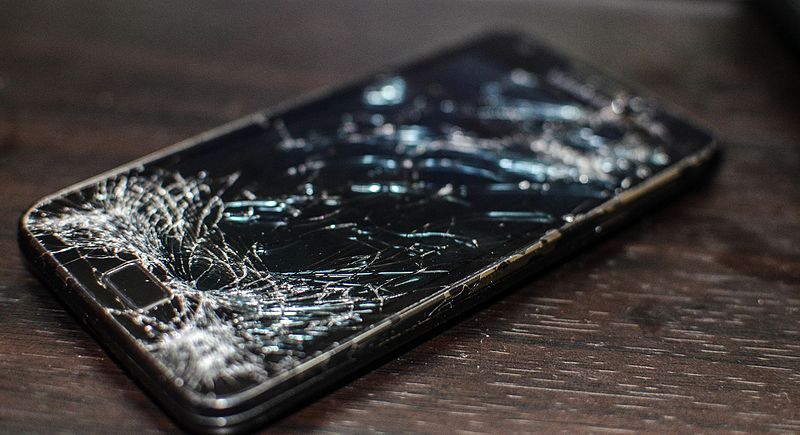
It’s happened to at least one of our smartphones or tablets. Our pride and joy piece of tech gets dented with an ugly crack or scratch. Smartphones are so essential to modern life that we stuff them into bulging pockets and handbags, not noticing what else we also can’t live without. Bunches of keys and coins don’t rub along too well with shiny glass surfaces. Happily advances in toughened glass chemistry are making these accidents less common.

smartphone glass
Cracked smartphone screen

A group from the Department of Applied Physics at Tohoku University in Japan recently reported a new way to study what makes the glass in our smartphones increasingly withstand everything our packed lives and handbags can throw at them. Writing in Nature Communications Physics, Professor Nobuaki Terakado described the valuable additional information that Raman microscopy gives glass technologists like Corning Inc. compared to existing materials characterisation methods.

Corning make the famous toughened Gorilla Glass that is found in an incredible 2 billion portable electronic devices. Gorilla Glass is much tougher than ordinary glass thanks to a clever surface modification that puts a compressive stress into a thin layer less than 50 microns thick. There is a cool video on the Corning website showing how the process works. Normal glass (like a wine glass or tumbler is made from) is a mixture of sand (sodium silicate) and boron trioxide. Corning glass used in smartphones contains aluminium oxide, making a harder and more resistant alumino-silicate glass. The really clever bit though is the surface modification step. At high temperature, the Corning glass surface is exposed to potassium ions in potassium oxide that swap places with sodium ions in the surface of the glass. When the glass cools down, the Gorilla Glass is left with a thin surface layer that has a residual compressive stress because the potassium ions are slightly bigger than the sodium ions in the rest of the material.

It is this stress that toughens the surface and makes it resist scratching and cracking. So stress is good, who knew?

Gorilla glass chemistry
Alkali ion (yellow) and silicate chains (blue/green/grey) in Gorilla Glass (courtesy Corning Inc)

Understanding what happens when the alumino-silicate molecules and the alkali (sodium Na/ potassium K) ions get swashed together is crucial to predicting the enhanced properties of Gorilla Glass. Terakado and his team have shown that Raman microscopy reveals changes in the bonding of the silicate molecules and the ions. Not only can you see the effect of the residual stress you can non-destructively see the changes in the chemical bonds in the material as a function of depth. They managed this by measuring changes in the Raman vibrational fingerprint in the surface layer compared to the bulk. Other materials characterisation techniques can measure the amounts of potassium in the glass but only vibrational Raman microscopy can reveal the way the molecules and ions are crucially bonded together to create incredible strength and resistance.

The recent Nature Communications Physics paper is available for download. Follow the link to find further reading on Corning Gorilla Glass 3. Cracked smartphone image : ( used with permission from https://commons.wikimedia.org/wiki/File:Samsung_Galaxy_S2_shattered_screen.jpg .

H+E stained tissue
Bone cancer diagnosis by Raman microscopy

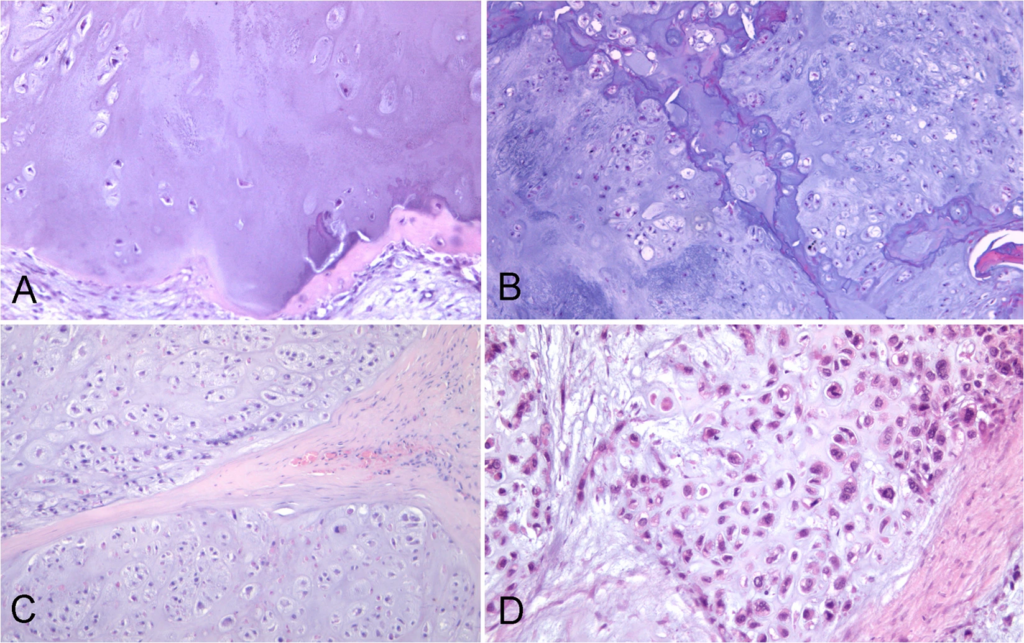
Pathologists have an unenviable job. Armed with just their eyes, their experience and a pinky-coloured picture they must decide whether a patient requires life-saving surgery, has nothing to be concerned about or just needs to be kept an eye on.

h+e stained biopsy images
H+E stained tumor biopsies A) EC, B)CS:G1, C) CS:G2, D) CS:G3 (from Nature Scientific Reports)

No matter which part of your body might have started behaving badly, a biopsy is the most likely procedure to reveal a potential problem or give the reassuring all-clear. Once the biopsy sample has been taken it is preserved, thinly sliced and then typically stained with H+E (hematoxylin and eosin) stain. When an experienced pathologist looks at a microscope image of a good quality stained sample, they are extremely successful in classifying the tissue and providing an accurate diagnosis.

Even though H+E staining has been used for more than 100 years to reveal the microscopic structure of different tissues, there is no single protocol or set of chemical reagents to produce identical results time and time again. Each pathology lab technician will have their own preferred way of preparing stained biopsy samples. The introduction of digital imaging of the view down the microscope has made it easier and quicker for a pathologist to assess a particular biopsy sample but variability in staining persists and can make it challenging to classify different cell morphologies. Staining is cheap and widely used but can be time consuming and does not always give pathologists the quality of images they need.

For these reasons, researchers have been developing Raman microscopy as an alternative pathology tool. Dr Mario D’Acunto at the IBF-CNR, Istituto di Biofisica and colleagues at the University of Pisa recently reported a pilot study of patients with bone tumors. Publishing in Nature Scientific Reports, they describe how tumors can be classified by Raman microscopy without the need of stains or time-consuming sample preparation. Using statistical methods on Raman microscope images of biopsy samples, they obtained 90% sensitivity, 90% specificity and 90% accuracy in classifying tumor types. This is comparable with the performance of expert pathologists assessing the best quality stained images.

So how does Raman microscopy work and what are the statistical methods D’Acunto et al used? In Raman microscopy a laser is scanned over the surface of the biopsy sample and the light scattered by the sample gives a kind of fingerprint of the different molecules present at each point in the image. The fingerprint is known as its vibrational spectrum. Information about even subtle changes in the way molecules are joined together can be extracted from individual points in the image. It is also possible to use statistical methods to extract similarities and differences between the vibrational spectra of the whole Raman image. These similarities are known as Principle Components and by carefully comparing the relative amounts of different Principle Components of each type of biopsy, it was possible to classify different tumor types.

Accurate bone tumor classification based on biopsy is crucial. Benign EC (enchondroma) tumors are not concerning but CS (chondrosarcoma) tumors account for around 20% of malignant bone tumors and must be detected. Of increasing concern are CS1 (chondrosarcoma 1) which rarely metastasize (spread) and CS2 and CS3 which can metastasize in up to 70% of cases. Catching CS type tumors quickly is therefore important and correctly differentiating CS2 and CS3 from CS1 types is crucial so that effective treatment can be prioritised.

Raman microscopy therefore looks to have an important role to play in the future of pathology and, cancer diagnosis and treatment. Combined with statistical methods and new artificial intelligence tools, major advances in the 100 year old science of tissue imaging are knocking at the path lab door.

The whole journal article can be found at https://www.nature.com/articles/s41598-020-58848-0 . A practical introduction to H+E staining can be found on the Leica microscope website.