Search for:
french bean leaves
Mineral deficiency in bean leaves classified by multispectral imaging
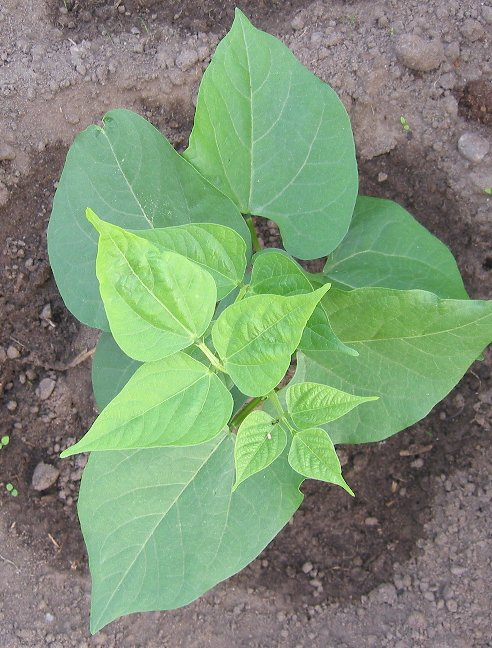
French bean Phaseolus Vulgaris (Image courtesy of WikiMedia Creative Commons)

Plants tell us when they are lacking vital nutrients but we can’t always hear what they are saying. Nitrogen, phosphorous and potassium (N, P, K) are well know macronutrients and the appearance of plants lacking any one of them is also well known. Plants lacking nitrogen have small leaves and stunted growth, those lacking phosphorous have poorly developed root systems and plants deficient in potassium fail to flower well.

Micronutrients, including magnesium, boron and iron (Mg, B and Fe) also affect the way plants grow and function but act together with N P and K in ways that can be complicated. This means that chemical analysis is required to identify which element is lacking and how much should be added to a growing crop or to a field before sowing seed. Quantifying the elements present in plant material is straightforward to do in the lab but time consuming. If analysis is prompted by how the plant looks to the eye, it is also too late to correct a nutrient problem. To be useful, micronutrient analysis must be carried out at an early stage in plant development.

Researchers from the Department of Plant Development at the University of Zagreb recently reported that multispectral imaging of plant leaves can be a quick, early and non-destructive way to classify nutrient deficiency in young bean plants. Writing in the latest edition of the journal Frontiers in Plant Science, Boris Lazarevic and team described how multispectral imaging of french bean leaves can be used to distiguish normal healthy plants from those lacking nitrogen, phosphorous, potassium, magnesium or iron. Just three days after introducing nutrient deficient conditions, multispectral imaging correctly classified 92% of bean plants suffering from deficiency. After twelve days, 100% of bean plants could be correctly classified as healthy or deficient in N P K Mg and Fe.

How did they achieve this?

CaBinet
PlantExplorer multispectral leaf imager (image courtesy of PhenoVation)

The team from Zagreb used an instrument similar to the PlantExplorer (shown above) to image juvenile leaves of french bean plants in containerised trays. Each tray contained plants growing in hydroponic media and was imaged at 3, 6, 9 and 12 days after the introduction of test solutions. A control solution with a cocktail of standard macro and micronutrients was the basis for the other nutrient deficient test solutions. Individual trays were grown with solutions lacking N, P, K, Mg and Fe components.

A phenotype or set of physical characteristics was used to identify potential changes in the leaves resulting from growing in solutions deficient in each mineral. These spectral parameters were either the reflectance of the leaves at different wavelengths (640, 550, 475, 510-590, 730, 769, 710 nm) or parameters (eg. green leaf index GLI, chlorophyll index CHI, anthocyanin index ARI, hue, saturation and intensity) derived from the images.

So far so good but how to extract useful information from the image data and how to evaluate the information? Lazarevic and team chose a statistical method known as linear discriminant analysis (LDA). LDA is a powerful way to use parameters or combinations of parameters that group together data from one set of plants and distinguish that set of plants from other sets of plants. In the case of the mineral deficiency study, the sets represented plants in each tray.

Decision tree for classification of plant leaf images based on multispectral parameters (Image courtesy of Frontiers in Plant Science Journal and the University of Zagreb)

The figure above shows how multispectral parameters were used to classify plant leaf images. Each three day timepoint is denoted by MT1, MT2, MT3, MT4. It is interesting to note that different discrimination criteria were used for different measurement dates. Different colours represent the different missing minerals. After 12 days, using LDA, it was possible to correctly classify virtually all the plant images into control, N P K Mg and Fe deficient groups. After just 3 days (MT1) most of the plant images were correctly classified but not with the same criteria as those used on other dates.

In addition to multispectral measurements on the plant trays, the Zagreb group also evaluated chlorophyll fluorescence and morphological measurements as potential techniques for mineral deficiency classification. Chlorophyll fluorescence is of interest because it can reveal levels of plant activitity or function. Morphological measurements, such as plant height, have long been used by farmers to check the progress of crops.

However neither method was as successful as multispectral imaging in classifying mineral deficiency. The paper from the Department of Plant Development at the University of Zagreb reveals that multispectral imaging can be used to classify different mineral deficiencies in plants. Consequences of mineral deficiency can be detected after only three days but the fact that each measurement date requires a different set of classification criteria suggests that the methods tested are not yet robust enough to use as generic measures of mineral deficiency.

It will be fascinating to see how far the multispectral imaging methods can be developed into routine diagnostic techniques for farmers.

The full Journal of Plant Science article can be found here.

Information about the BACO multispectral imaging instrument available from Corbeau Innovation can be found here.

Precision viticulture coming to fruition
baco_multispectral_vine_leaf_imager
BACO multispectral leaf imager on a grape crate

Mists, check. Mellow fruitfulness, check. Maturing sun, – eventually check! In the UK the 2021 growing season has been good but not exceptional. A late spring followed by a warm June and July gave way to a disappointing August with plenty of warm damp days to encourage the development of mildew. It has been fascinating to follow the 2021 Llanerch Precision Viticulture Pilot Study from bud-burst to final harvest. As followers of the study will know, we started in April with the installation of a SensIT microclimate weather station and then made the first BACO multispectral leaf measurements at the end of May. BACO leaf measurements continued approximately every two weeks until harvest was completed on 22nd October.

Season of mists and mellow fruitfulness,

Close bosom-friend of the maturing sun;

Conspiring with him how to load and bless

With fruit the vines that round the thatch-eves run;

To Autumn by John Keates (1795-1821)

SensIT and BACO are two of the key components of the Xloora precision viticulture system. SensIT is an IoT (Internet Of Things) weather station measuring %RH, T, wind speed and direction, wet-leaf, rainfall, sunshine and air pressure. Hourly readings are uploaded to the Xloora cloud platform and used to predict the likelihood of disease development. BACO uses seven different wavelengths of light from deep blue to near infrared to take pictures of vine leaves. Ratios of these images can give measures of leaf pigments such as chlorophyll, carotene and anthocyanin. They can also give early indication of disease development, forewarning the farmer of problems before they are obvious to the human eye.

  • New SensIT in vineyard
  • BACO multispectral leaf imager
  • reichensteiner multispectral leaf measurements

BACO also has GPS so that the locations of vine readings can be associated with blocks of different grape varieties. The web browser user interface shows individual measurements, alerts and reports over longer periods of time.

The grape harvest at Llanerch this year has been tremendous, a great crop achieved with few interventions to control disease. From reichensteiner to solaris, to seyval blanc, phoenix and even the old triomphe d’Alsace, vines have been heavy with bunches of grapes. A great collection of outputs from the vineyard. What about the Pilot Study?

Over the season there were more than 3,500 IoT data uploads and more than 28,000 microclimate records generated. Almost 300 multispectral sets of images were generated by BACO making more than 2,000 leaf images in total.

Detailed analysis of the data, reports and alerts has just started but some interesting results are already clear. At harvest just one block, the reichensteiner, had obvious signs of developing mildew on some of the vines. A time series of representative leaf images from the rows in question shows the progressive change:

NDVI leaf images of susceptible reichensteiner vines, acquired with BACO from June to October

It appears by visual inspection that the leaf ratio (normalised difference vegetation index, NDVI) images become much less uniform as the disease burden grows through the year. Finally mildew is evident to the human eye in late October.

SensIT microclimate data from the vineyard at Llanerch was compared with a feed from a commercial weather station in the area. While the temperature and relative humidity values were generally similar, there were notable deviations.

Comparison of both the temperature and Relative Humidity data from the same period in August reveals that the microclimate of the vineyard follows the general trend of the meteo reports but changes are much more pronounced. Presumably this is because the vineyard at Llanerch has an open aspect which warms and cools more quickly than the location of the meteo report sensors (which was not known precisely). Accurate data from the vineyard is likely to be crucial to the success of predicting the start and spread of diseases like downy and powdery mildew.

A more detailed analysis of the Xloora precision viticulture platform results will be carried out over the coming weeks in preparation for extending the trial next year.

Visit us at the Vineyard Show 2021 at the Kent Showground on 24th November, booth S8

Read more about SensIT, BACO and Xloora here