Smartphone spectral leaf imaging

Plants tell us when they are lacking vital nutrients but we can’t always hear what they are saying. Nitrogen, phosphorous and potassium (N, P, K) are well know macronutrients and the appearance of plants lacking any one of them is also well known. Plants lacking nitrogen have small leaves and stunted growth, those lacking phosphorous have poorly developed root systems and plants deficient in potassium fail to flower well.
Micronutrients, including magnesium, boron and iron (Mg, B and Fe) also affect the way plants grow and function but act together with N P and K in ways that can be complicated. This means that chemical analysis is required to identify which element is lacking and how much should be added to a growing crop or to a field before sowing seed. Quantifying the elements present in plant material is straightforward to do in the lab but time consuming. If analysis is prompted by how the plant looks to the eye, it is also too late to correct a nutrient problem. To be useful, micronutrient analysis must be carried out at an early stage in plant development.
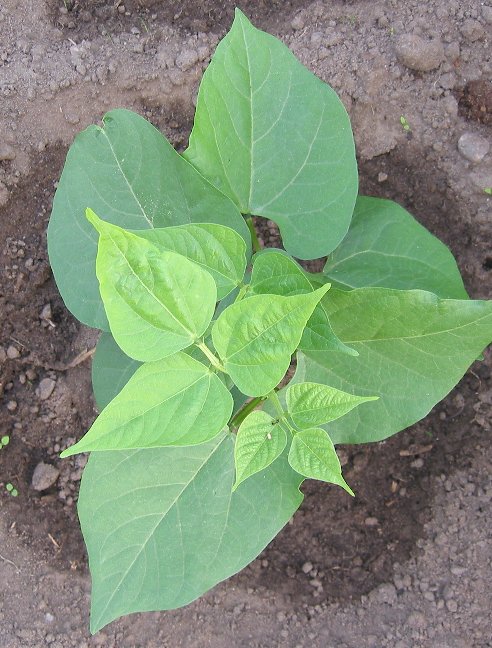
Researchers from the Department of Plant Development at the University of Zagreb recently reported that multispectral imaging of plant leaves can be a quick, early and non-destructive way to classify nutrient deficiency in young bean plants. Writing in the latest edition of the journal Frontiers in Plant Science, Boris Lazarevic and team described how multispectral imaging of french bean leaves can be used to distiguish normal healthy plants from those lacking nitrogen, phosphorous, potassium, magnesium or iron. Just three days after introducing nutrient deficient conditions, multispectral imaging correctly classified 92% of bean plants suffering from deficiency. After twelve days, 100% of bean plants could be correctly classified as healthy or deficient in N P K Mg and Fe.
How did they achieve this?

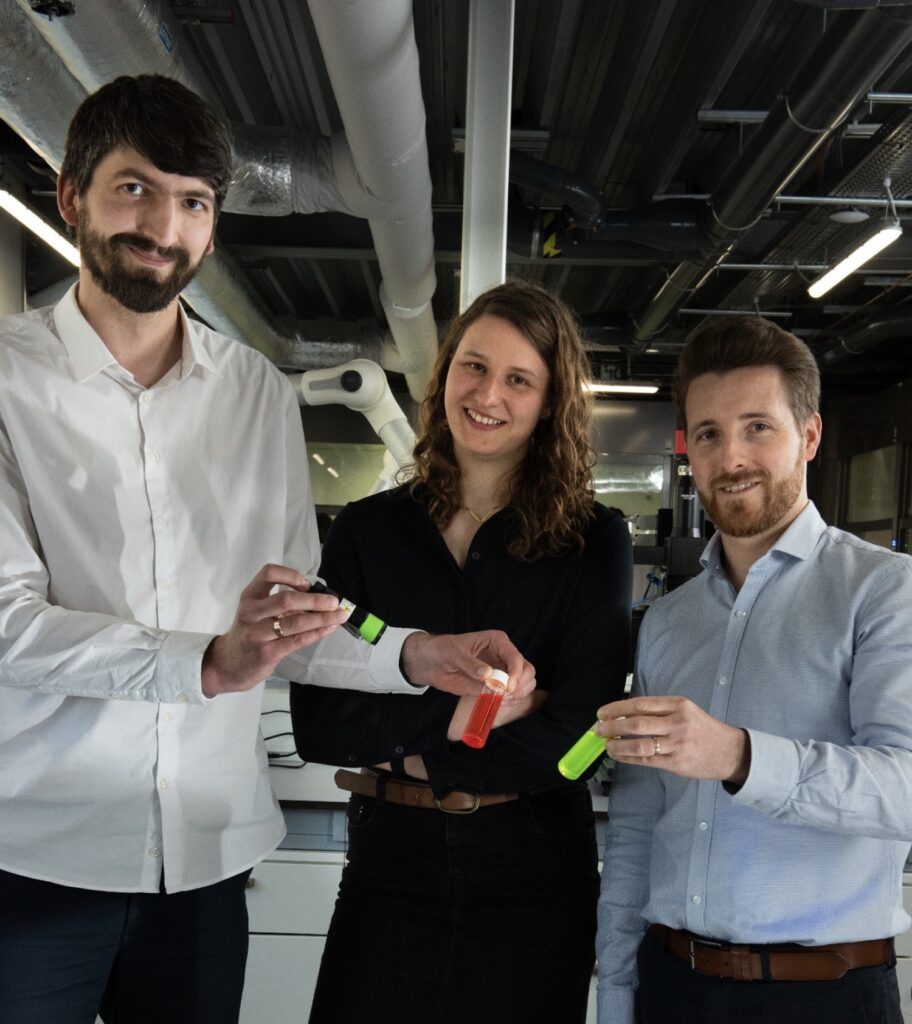
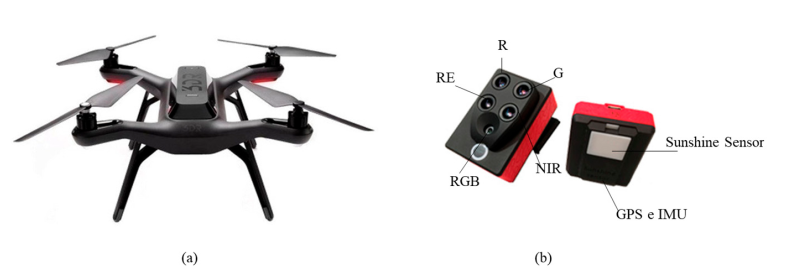
The team from Zagreb used an instrument similar to the PlantExplorer (shown above) to image juvenile leaves of french bean plants in containerised trays. Each tray contained plants growing in hydroponic media and was imaged at 3, 6, 9 and 12 days after the introduction of test solutions. A control solution with a cocktail of standard macro and micronutrients was the basis for the other nutrient deficient test solutions. Individual trays were grown with solutions lacking N, P, K, Mg and Fe components.
A phenotype or set of physical characteristics was used to identify potential changes in the leaves resulting from growing in solutions deficient in each mineral. These spectral parameters were either the reflectance of the leaves at different wavelengths (640, 550, 475, 510-590, 730, 769, 710 nm) or parameters (eg. green leaf index GLI, chlorophyll index CHI, anthocyanin index ARI, hue, saturation and intensity) derived from the images.
So far so good but how to extract useful information from the image data and how to evaluate the information? Lazarevic and team chose a statistical method known as linear discriminant analysis (LDA). LDA is a powerful way to use parameters or combinations of parameters that group together data from one set of plants and distinguish that set of plants from other sets of plants. In the case of the mineral deficiency study, the sets represented plants in each tray.

The figure above shows how multispectral parameters were used to classify plant leaf images. Each three day timepoint is denoted by MT1, MT2, MT3, MT4. It is interesting to note that different discrimination criteria were used for different measurement dates. Different colours represent the different missing minerals. After 12 days, using LDA, it was possible to correctly classify virtually all the plant images into control, N P K Mg and Fe deficient groups. After just 3 days (MT1) most of the plant images were correctly classified but not with the same criteria as those used on other dates.
In addition to multispectral measurements on the plant trays, the Zagreb group also evaluated chlorophyll fluorescence and morphological measurements as potential techniques for mineral deficiency classification. Chlorophyll fluorescence is of interest because it can reveal levels of plant activitity or function. Morphological measurements, such as plant height, have long been used by farmers to check the progress of crops.
However neither method was as successful as multispectral imaging in classifying mineral deficiency. The paper from the Department of Plant Development at the University of Zagreb reveals that multispectral imaging can be used to classify different mineral deficiencies in plants. Consequences of mineral deficiency can be detected after only three days but the fact that each measurement date requires a different set of classification criteria suggests that the methods tested are not yet robust enough to use as generic measures of mineral deficiency.
It will be fascinating to see how far the multispectral imaging methods can be developed into routine diagnostic techniques for farmers.
The full Journal of Plant Science article can be found here.
Information about the BACO multispectral imaging instrument available from Corbeau Innovation can be found here.


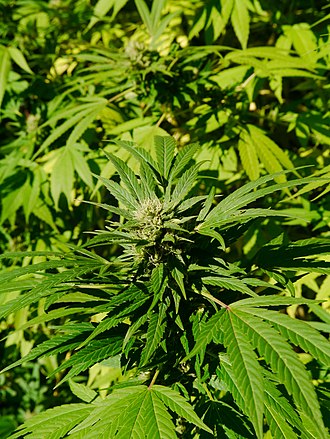

It turns out that growers of medicinal cannabis and those catering for a more recreational market love females but hate males. Gender bias is certainly in the news today but horticulturalists have long known that female hemp plants have higher levels of pharmacologically active compounds than male plants. The difference in yield between the sexes is so large that it can make cultivation uneconomic.
There are three main pharmacologically active chemical compounds in hemp (Cannabis sativa) plants. Cannabidiol (CBD) and cannabigerol (CBG) are the main cannabis compounds of pharmaceutical interest, while hemp plants which contain more than 0.3% tetrahydrocannabinol (THC) are frequently classified as marijuana. Collectively, this family of compounds are known as cannabinoids.
Male cannabis plants produce male flowers and female plants produce female flowers with higher levels of cannabinoids. Flowers are relatively easy to tell apart but the plants need to be identified as male or female before flowering so that males can be removed and preferably not cultivated at all. It is therefore important to pharmacology research and therapeutics development that plants are identified before flowering. Genetic tests exist but cannot give an immediate result in the field.
Researchers at Texas A&M University have developed an immediate, non-invasive method of determining the sex of hemp plants with a success rate of up to 94%. Professor Kurouski’s team used a handheld Raman spectrometer to measure not the cannabinoids themselves but the pigments that give plants their colour. A commercially available Raman spectrometer (shown below) with a 830 nm wavelength near infrared laser was used to analyse the pigments in the plant leaves.

Raman spectroscopy is a powerful chemical analysis technique that records a ‘chemical fingerprint’ of the vibrations of bonds in molecules. When a laser is focused onto a substance, almost all over the laser light is reflected or scattered with exactly the same colour as the laser. A tiny fraction, less than a millionth of the incident light, interacts with vibrations of molecules in the substance. As a result the light loses energy and becomes red-shifted. A Raman spectrometer spreads out the red-shifted light to reveal an array of slightly different coloured spots. Each one of these light peaks corresponds to a specific molecular vibration and forms the Raman spectrum or ‘fingerprint’ of the substance.

Averaged Raman spectra from male and female plant leaves showed small but consistent differences. Female plant leaves gave higher intensities of peaks associated with plant pigments and other biomolecules. Plant pigments typically include chlorophyll, lutein, lycopene, beta carotene, cryptoxanthin and zeaxanthin.
In order to investigate which plant pigment could be contributing to the differences between the male and female Raman spectra, the Texas A&M team took leaf samples from the same plants and analysed them by high pressure liquid chromatography (HPLC). HPLC comparison showed that female plant leaves generally had higher levels of pigments and had clearly higher levels of the pigment lutein. Differences in the Raman spectra of male and female hemp leaves were therefore associated with the plant carotenoid lutein.
In order to make a predictive model they used partial least squares discriminant analysis (PLS-DA), based on two components of the second derivative of the Raman spectra. When the male and female results were analysed based on the two components, it was found that around 90% of young plant leaves could be correctly identified as male or female and 94% of mature plant leaves could be correctly classified.
Professor Dmitry Kurouski and his group have therefore developed a new method of quickly determining the sex of young cannabis hemp plants in the field or greenhouse. The Raman method has the potential to improve the efficiency of medicinal cannabis production and aid research into new pharmacologically active substances.
You can find the full paper recently published by Springer-Verlag here.
News from Dmitry’s group at Texas A&M can be found on his website.
Related research on Raman analysis of hemp leaves can be downloaded from this Open Access Source.
Related research on using Raman analysis to measure plant disease can be found here.
If you want to try your Python skills at PLS-DA there is a useful practical introduction here.
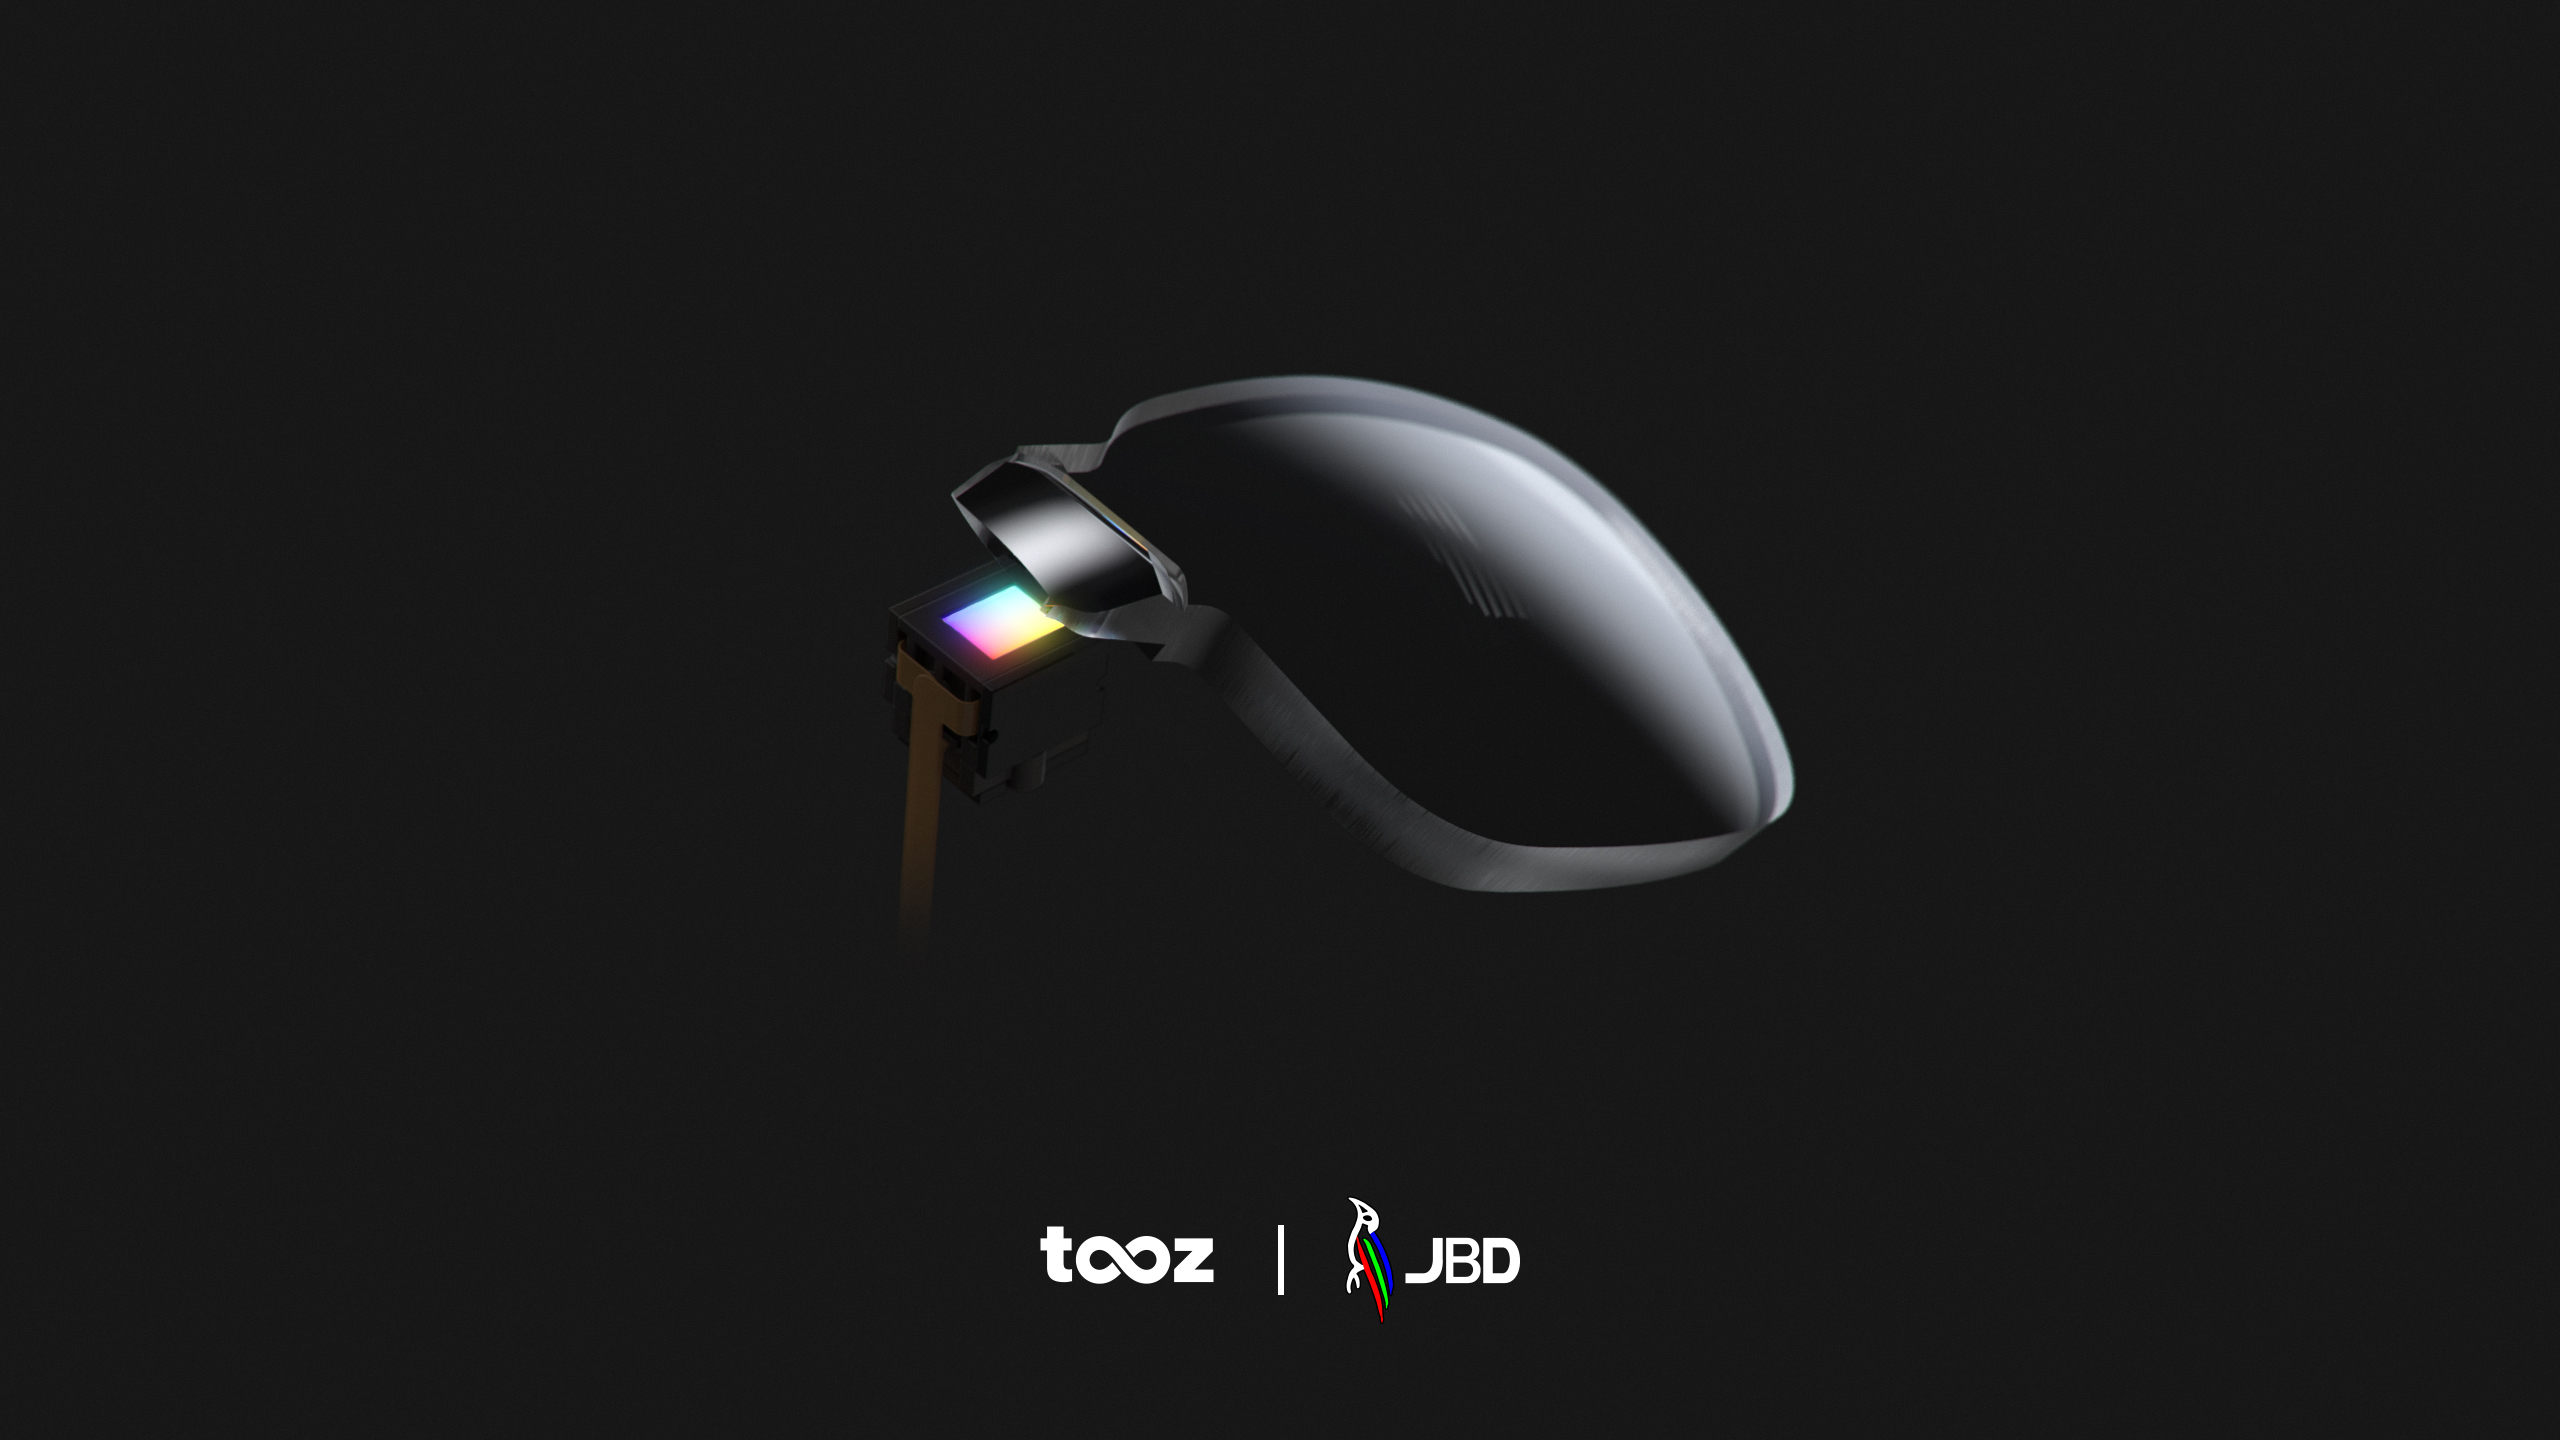

What happens when you put two superior optical technologies together? In the case of smart glasses you get bigger, brighter and less blurry.
Kingsman-style smart glasses have been available for more than a year now but they typically have flat glass lenses which are difficult to adjust for the 50% of the adult population who wear prescription glasses. A new joint venture between microLED device manufacturer Jade Bird Display (JBD) and smart glasses developer tooz technologies GmbH (tooz) is set to change that. On January 20th 2022 the companies announced a collaboration to put bright microLED displays into glasses with curved lenses. A first demonstration is taking place at the Photonics West SPIE AR VR MR 2022 exhibition (23rd – 25th January 2022 in San Francisco, USA).
Almost exactly one year ago Corbeau reported an Insight on new micro-LED driven smart glasses from Vuzix, a major breakthrough in terms of connectivity and what we now call the Metaverse. With existing products for industrial and medical applications, Vuzix announced the NGSG (Next Generation Smart Glasses) for the consumer market. NGSG combined tiny high resolution microLED red/green/blue displays with their state-of-the-art waveguide optics for displaying 3D images in front of the wearer’s eyes.
In the past year a number of new players have entered the market with their own smart glasses. Xiaomi, a budget smartphone manufacturer from China, has glasses with a monochrome green display based on what looks like a Jade Bird Display 0.1″ device. Lenovo has launched the ThinkReality A3 with high resolution AR display but a rather heavy look. TCL’s Nxtwear G glasses offer high resolution cinema-style projection and get around the prescription lenses issue with a custom frame that looks a bit like Neo and Trinity’s eyeware from the Matrix. But on stalks.
tooz (it seems strange to start a sentence without a capital letter) make much of their new curved waveguide technology. Vuzix developed a waveguide element to their smart glasses which enabled light of different wavelengths to be projected as a image in three dimensions in front of the wearer’s eyes. This was amazingly cool. tooz have gone one better and invented a curved waveguide, which realises a number of improvements to the design and performance of smart glasses. Reading through technical presentations from tooz, Corbeau spotted seven major advantages of curved waveguides compared to planar waveguides:

Where do Jade Bird Display fit into the picture? tooz started developing their smart glasses with OLED light sources rather than microLED. OLEDs typically have some advantages but their big disadvantage is the displays are not as bright as microLED displays. Waveguides have amazing properties but are lossy, they waste much of the light intensity passing through them. The tiny microLED displays from JBD have brightness values of millions of nits (the iPad has a humble several thousand nits). This means they can be used outdoors in full sun, to project usable images over wide angles even though much of the light is lost in the waveguide. JBD also have a rather neat X-cube optic which combines the outputs from tiny individual red, green and blue microLED displays no bigger than a grain of rice.

So where does this great technical synergy lead? With the possibility of smart glasses for the whole population, including the 50% who require prescription lenses, a massive potential market is opened up. tooz aren’t just targeting technophiles, they have real-life commercial applications in their sights. Vuzix have a business model that has targetted early adopters in the engineering services sector. tooz are pushing their new products into engineering and medicine. They have a fascinating promo video of a pilot study at the University Hospital of Dresden (see the bottom of this Insight for a link).

One more thing. tooz started out as a new venture between optics experts Carl Zeiss and IT giant Deutsche Telekom. They have automated manufacture for volume manufacture of optics and real reach into IoT in the field.
Smart glasses are now real products with commercial benefits. The party is just getting started and we haven’t seen what Apple and Facebook will bring to the party yet. Could the next two years see the death of the smart phone and the birth of the Matrix?
Visit the Photonics West SPIE AR | VR | MR 2022 .
Find more tooz company information .
Find more Jade Bird Display company information .
See the Xiaomi smart glasses video.
View the TCL Nxtwear G glasses.
See the tooz glasses University Hospital Dresden promo video

Autumn is a time of year that the folk at Porotech in Cambridge, UK seem to love. Those deep red autumn colours mark a year of significant growth. This time last year Porotech announced they could fabricate wafer-scale red emitting nano-porous InGaN, suitable for microLEDs.
This autumn Porotech are announcing a ‘world first’ red microLED display based on InGaN. Red microLED display devices based on InGaN are a game-changer for AR (augmented reality) and VR (virtual reality) display devices. Why?
All video display devices are based on composite red, green and blue light signals which the human eye recognises as a millions of different colours. To achieve this pc monitors, televisions and digital projectors use red, green and blue light sources. A variety of different LED choices are available for each of these colours however until recently their light emitting materials had quite different compositions. For large panel displays this is not a huge problem, individual LEDs can be picked and placed together by machine. Tiny display devices used in AR are much more demanding.
For smart glasses, the display device must be less than 10 mm in size and to get anything approaching high definition, it must contain something like 1000×1000 pixels. A simple sum tells us that each of the one million pixels can be no larger than 10 microns! Modern microelectronics fabrication methods can easily make structures 100 times smaller than this but mixing different LED materials is a huge practical challenge. Enter the Porotech solution.

Porotech was spun out of the University of Cambridge to exploit so-called nano-porous gallium nitride materials. InGaN (indium gallium nitride) is a compound semiconductor whose optoelectronic properties can be tuned not only by changing the precise composition but also by creating nano-scale voids.
The traditional way to produce red light from InGaN was to add aluminium and phosphorous atoms to produce red-emitting AlInGaNP. However making very small volumes of uniform semiconductor material from many elemental components is problematic as well as expensive. CEO and co-founder of Porotech Tongtong Zhu put it like this:
Porotech’s new class of porous GaN semiconductor material is now redefining what is possible – enabling the creation of efficient and bright native-red InGaN micro-LEDs and micro-displays
Tongtong Zhu CEO & co-founder, Porotech
Just how likely is this to happen? Over the summer Porotech have been busy adding three valuable components to the technology. In June a further £3M funding round was secured, led by Speedinvest. In August a key partnership was announced with major Chinese device manufacturer Jade Bird Display. Finally in September Porotech secured the services of former ARM executive Helen Adams as Chief Commercial Officer.
One mobile phone network provider used to claim that “the future’s bright, the future’s Orange”. Today for Porotech it seems “the future is bright, the future is red, green, blue, in fact any colour you want!”
Find out more about Porotech’s technology here.
Discover more about the Jade Bird Display venture here.
Discover our own microLED inspection & defect review products

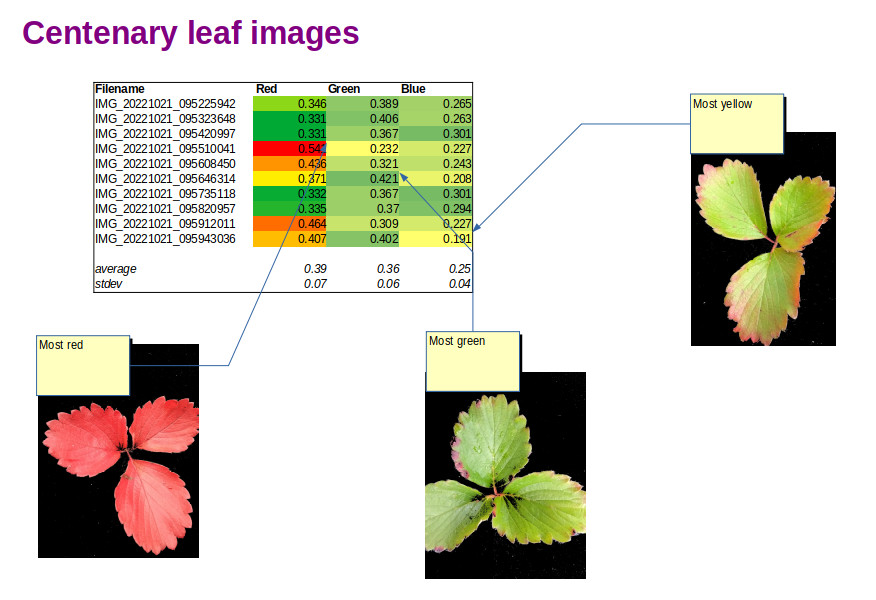
Mists, check. Mellow fruitfulness, check. Maturing sun, – eventually check! In the UK the 2021 growing season has been good but not exceptional. A late spring followed by a warm June and July gave way to a disappointing August with plenty of warm damp days to encourage the development of mildew. It has been fascinating to follow the 2021 Llanerch Precision Viticulture Pilot Study from bud-burst to final harvest. As followers of the study will know, we started in April with the installation of a SensIT microclimate weather station and then made the first BACO multispectral leaf measurements at the end of May. BACO leaf measurements continued approximately every two weeks until harvest was completed on 22nd October.
Season of mists and mellow fruitfulness,
Close bosom-friend of the maturing sun;
Conspiring with him how to load and bless
With fruit the vines that round the thatch-eves run;
To Autumn by John Keates (1795-1821)
SensIT and BACO are two of the key components of the Xloora precision viticulture system. SensIT is an IoT (Internet Of Things) weather station measuring %RH, T, wind speed and direction, wet-leaf, rainfall, sunshine and air pressure. Hourly readings are uploaded to the Xloora cloud platform and used to predict the likelihood of disease development. BACO uses seven different wavelengths of light from deep blue to near infrared to take pictures of vine leaves. Ratios of these images can give measures of leaf pigments such as chlorophyll, carotene and anthocyanin. They can also give early indication of disease development, forewarning the farmer of problems before they are obvious to the human eye.
BACO also has GPS so that the locations of vine readings can be associated with blocks of different grape varieties. The web browser user interface shows individual measurements, alerts and reports over longer periods of time.
The grape harvest at Llanerch this year has been tremendous, a great crop achieved with few interventions to control disease. From reichensteiner to solaris, to seyval blanc, phoenix and even the old triomphe d’Alsace, vines have been heavy with bunches of grapes. A great collection of outputs from the vineyard. What about the Pilot Study?


Over the season there were more than 3,500 IoT data uploads and more than 28,000 microclimate records generated. Almost 300 multispectral sets of images were generated by BACO making more than 2,000 leaf images in total.
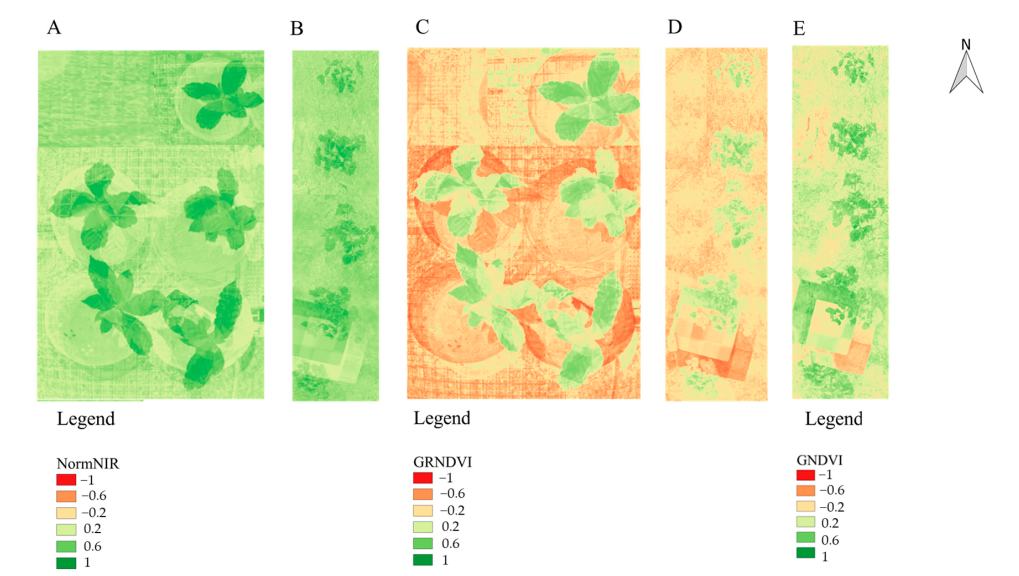
Detailed analysis of the data, reports and alerts has just started but some interesting results are already clear. At harvest just one block, the reichensteiner, had obvious signs of developing mildew on some of the vines. A time series of representative leaf images from the rows in question shows the progressive change:

It appears by visual inspection that the leaf ratio (normalised difference vegetation index, NDVI) images become much less uniform as the disease burden grows through the year. Finally mildew is evident to the human eye in late October.
SensIT microclimate data from the vineyard at Llanerch was compared with a feed from a commercial weather station in the area. While the temperature and relative humidity values were generally similar, there were notable deviations.


Comparison of both the temperature and Relative Humidity data from the same period in August reveals that the microclimate of the vineyard follows the general trend of the meteo reports but changes are much more pronounced. Presumably this is because the vineyard at Llanerch has an open aspect which warms and cools more quickly than the location of the meteo report sensors (which was not known precisely). Accurate data from the vineyard is likely to be crucial to the success of predicting the start and spread of diseases like downy and powdery mildew.
A more detailed analysis of the Xloora precision viticulture platform results will be carried out over the coming weeks in preparation for extending the trial next year.

One of the most important sources of carbohydrate energy in equatorial countries comes from the cassava plant. It looks like a trendy house plant but the roots are large tubers that provide valuable nutrition. Tubers can be boiled and mashed or dried, ground and turned into flour. Cassava is a robust crop but suffers from two virus diseases that can ruin an entire crop with very little warning until the tubers are dug up at harvest. Rotten tubers cannot be used for food and signs of viral infection are not obvious on the leaves or stems until it is too late to plant a replacement crop. Propagation of cuttings for the following year’s crop is also affected by virus so potentially two years worth of food could be lost in a single infection.
Cassava mosaic virus (CMV) and cassava brown streak disease (CBSD) are the two main viral diseases responsible for crop loss. There are now cassava varieties that are resistant to CMV but CBSD is still problematic. There are various biochemical diagnostic tests for the diseases but the most reliable, a PCR test, is expensive, invasive and requires a relatively high level of viral load. Prompted by the need for a better, quicker test a team of researchers from University of Manchester, North Carolina State University, Rutgers University and the International Institute of Tropical Agriculture have developed a handheld multispectral leaf imager that detects the presence of CBSD before signs are obvious to the human eye.

In a pre-print paper last month, Hujun Yin and colleagues reported how a compact 14 wavelength multispectral leaf imaging device utilising machine learning successfully classified diseased plants and control plants. Photos of the device are shown below.

The Manchester study comprised three trials, each containing cassava plants naturally immune to CMV to minimise the chance of random viral infection from another source. All three trials had three treatment groups: controls; CBSD inoculated; and E. coli inoculated. The last treatment groups were used to test the susceptibility of the inoculation method itself, E. coli should have no effect on the health of the cassava plants. Plants were measured at days 7, 14, 21, 28, 52, 59 and 88 days post inoculation (dpi). Leaf images were recorded using 14 different LED light wavelengths (395, 415, 470, 528, 532, 550, 570, 585, 590, 610, 625, 640, 660, 700 and 880 nm). At each time point plant leaves were also given scores from 1 to 4 based on how they appeared to the eye. Typical leaves are shown below.

In trial 2, PCR tests were performed on leaves at each time point and visual scores were documented. The visual scores showed a progression with time for the inoculated leaves as expected (see below).

To verify that the virus was indeed successfully inoculated into the plants, PCR tests confirmed the virus present in some plant leaves after day 52, with the highest levels at the end of the time course.
Analysis of the leaf image spectral hypercubes (14 wavelengths x 12 random groups of leaf pixels) produced metadata consisting of six vegetation indices (VIs); average spectral intensities (ASIs) and texture (a measure of the variation of the intensities from pixel group to pixel group on a leaf). Interestingly, even some simple VIs were capable of distinguishing some diseased plants from healthy ones (more than 60% successful classification at day 52, comparable to the PCR testing).
Metadata was used to create a classifier based on measurements taken from plants with positive PCR test results. Rather than use a convolutional neural network (CNN) approach to classify the images or metadata, the team used a Support Vector Machine (SVM). SVMs have the advantage that they typically do not require high computing power and they can be intuitively quantitative using simple regression to find the best dividing lines between image categories. SVM produced a marked improvement in classification with better than 80% success as a result of using positional information in addition to VI. An introductory reference is given at the end of this post.
The group made one further improvement to their model and this was to combine subsets of classifiers produced by the SVM. They called this approach Decision Fusion (DF) and Probabilistic Decision Fusion (PDF), which is basically saying if one classifier doesn’t work, combine it with another and see if the performance improves. Finally they achieved sophisticated classification of diseased and healthy plants at day 53 and 80-90% success.
It will be very interesting to see multispectral imaging applied to more diseases and to the classification of differing diseases.
The pre-print paper can be found here, courtesy of Research Square and the authors Yao Peng, Mary Dallas, José T. Ascencio-Ibáñez, Steen Hoyer, James Legg, Linda Hanley-Bowdoin, Bruce Grieve, Hujun Yin.
A nice introduction to Support Vector Machines from MonkeyLearn can be found here.
Information on our own BACO multispectral leaf imager can be found here.

As the grapes swell in the late summer sun and rain, vignerons start thinking about the harvest. What is the yield going to be? how much sugar will there be in the grapes and finally how many bottles of wine can be made?
It would be really useful to have a way to predict the yield of each vine, sector and vineyard. Reliability is important because securing the wrong amount of vineyard labour, vat capacity or bottling can lead to either higher costs or loss of production. Hand counting is reliable but extremely time-consuming if a good representative portion of the vineyard is counted by visual inspection. Wouldn’t it be great if you could automate the inspection process by mounting a camera on a drone or quad-bike and then use AI (artificial intelligence) to pick out the grape bunches from the images of leaves, stems and bunches as the camera races up and down the rows of vines?
Well, this has been done by a number of developers and Corbeau reviewed one clever solution recently. The big challenge is to overcome the confusion of bunches partially obscured by leaves and stems.
Machine learning (ML) examples often use images of salads, with bright red tomato slices, green lettuce and orange carrot sticks. These can be easily sorted or counted using colour filters. In the vineyard you encounter green leaves, grapes, stems and tendrils. Each of them growing at different angles and with a range of different shades of green. Counting grape bunches is a much more difficult problem to solve than counting tomatoes.
Undaunted, Corbeau decided it was time to investigate Open Source AI as a way to count grape bunches in vine images. There are a wide range of Open Source tools available, some of which require programming expertise and some which do not. The main drawback of using Open Source tools is that the documentation is typically either very limited or written in a strange English dialect spoken only by Microsoft employees.

Corbeau started with a set of 30 colour vine images taken with a smartphone. Each image was taken in full sun and contained random combinations of grapes, leaves, stems and tendrils. Images typically covered a vine area of around 1 square metre. The first task was to create sets of annotations to identify features of interest. This was done manually with the Microsoft API, drawing labelling boxes around grape bunches and stems in the images. An example annotation is shown below.

A CNN (convolutional neural network) was chosen to create a machine learning model. Convolution methods are useful ways to emphasise shapes in images. They work by trying to make the image look like a particular pattern, for example parallel vertical lines or circles. After convolving a reference labelled box with a pattern, the simplified new image is assessed: is it more ‘like’ the pattern than something else? When many different patterns are convolved with an image, a set of patterns will tend to characterise one image more than another one. Each of the pattern ‘like’-ness tests can be made a decision point in making an image classification. In this sense the decision-point network is an intelligent classifier. The CNN requires some ground truth, defined by human definitions of what different bunches of grapes look like. It becomes intelligent by learning from human definitions of different bunches and stems.
The set of convolutions which classify a bunch and a stem are different and require verification and testing before they can be used as a machine learning classification model. New vine images were taken to verify the performance of the classification model. Bunch classification was more successful than stem classification because a much higher proportion of bunches were annotated in the learning set of images than stems. After a few hours developing better classification models, the model produced a 0.77 confidence level for bunch identification and 0.12 confidence level for stem identification. When presented with similar images (size, resolution, range) the model should be capable of identifying grape bunches and counting them. The model was deployed as a TensorFlow classification task, ready for counting grape bunches in additional grapevine images.
To test how this ML approach could be used in the vineyard, a burst series of smartphone images were recorded as the phone was carried parallel to a test vine. Running the ML model produced a list of potential image boxes found by the classifier, shown below.

Two bunches were identified with 1.000 (right hand bunch) and 0.928 (top left bunch) confidence levels. The next image box (at the bottom left side of the picture above) was not a bunch and had a 0.019 confidence level.
These results are an encouraging start to the machine learning bunch counting project. If you would like to take part in the project, please get in touch with Pierre Graves by completing the Contact form!


