Search for:
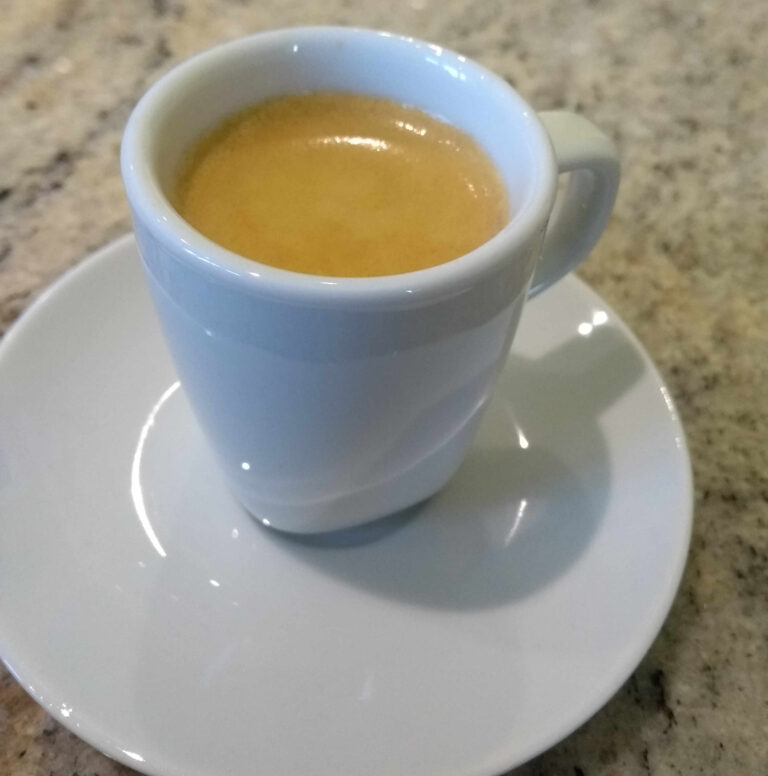
espresso coffee
Coffee leaf miner infection located by multispectral imaging
espresso coffee
espresso coffee

There’s an awful lot of coffee in Brazil! according to the old song recorded by Frank Sinatra. In 2021 almost 70 million 60kg bags of coffee were produced in Brazil, roughly one third of global production, making Brazil the largest coffee producer in the world. Yield varies from year to year depending mainly on the weather but also on disease risks.

Coffee leaf miner infection is a major cause of poor cropping and ultimately plant death. These little critters are the larvae of a tiny moth that lays its eggs on the surface of coffee plant leaves. They munch their way into leaves leaving black holes filled with (ahem) poop, which create the impression of tiny mine shafts in the leaf.

Researchers at the Federal University of Lavras in Brazil have demonstrated a new way to spot the effects of disease in coffee plants using a drone equipped with a multispectral imaging camera.
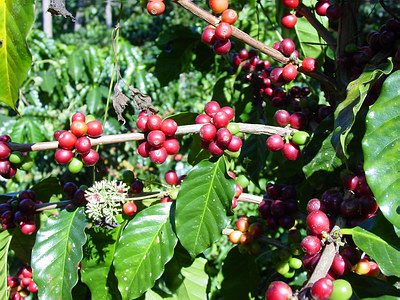
coffee plant
Healthy coffee plant (courtesy WikiMedia Commons)

They flew the drone over a coffee plantation in the Minas Gerais region of Brazil. At a height of 3m it was possible to record images of individual coffee leaves on different Coffea arabica L. plants, images being taken with a multispectral camera. Four wavebands were used for the imaging: 530-570 nm  (green); 640-680 nm (red); 730-740 nm (red edge); and 770-810 nm (near infrared). Similar images were recorded manually of the leaves of healthy coffee plants of the same species in a greenhouse for comparison.
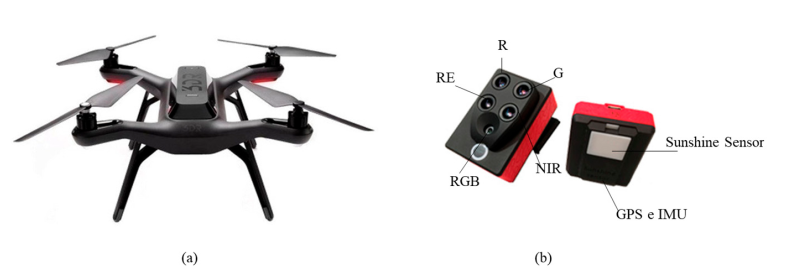
drone and multispectral camera
(a) Quadcopter drone and (b) multispectral camera used in plantation (courtesy AgriEngineering Journal and University of Lavras)

Images from any single camera waveband are subject to variations in sunlight and shadowing therefore researchers have developed a large number of different so-called Vegetation Indexes (VIs) to allow comparison of measurements on different days and at different locations. The normal method is to use a ratio of a camera waveband that changes a lot against a waveband that does not typically change very much. Possibly the most popular vegetation index is NDVI, Normalised Difference Vegetation Index:

NDVI = (NearInfrared – Red) / (NearInfrared + Red)

Plants absorb red and blue light strongly, reflecting green and near infrared therefore they have relatively high NDVI values (0.8-1.0). Basically the higher the NDVI value for a plant leaf, the greener and healthier it is. 

The team at Lavras wanted to discover which VI was the most effective at distinguishing healthy coffee leaves from leaves infected by coffee leaf miner. They reasoned that because infected leaves are generally darker due to the poop tracks, healthy  leaves should typically have higher VI values.
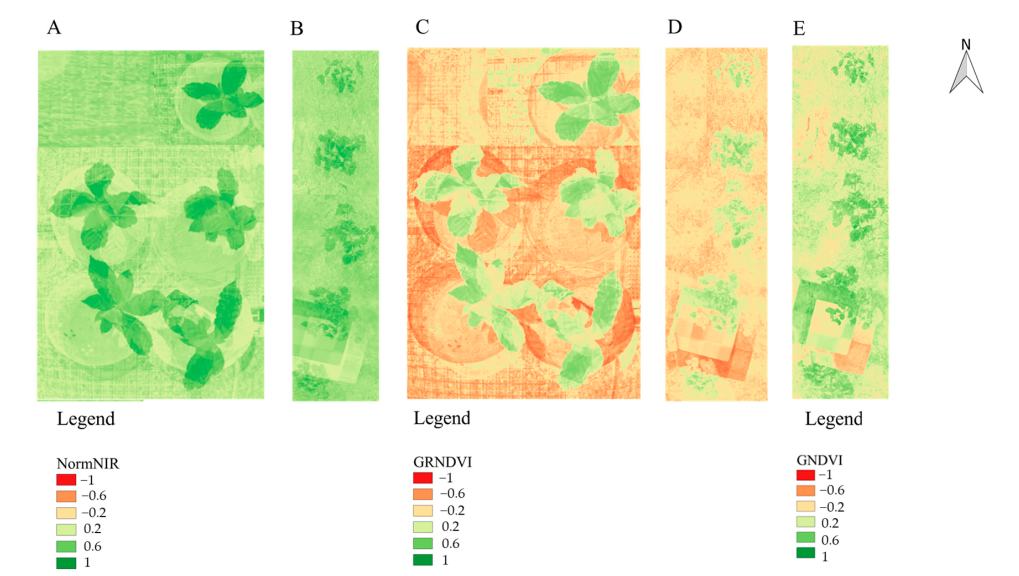
coffee plant vegetation index images
Coffee plant vegetation index images: (A, C) Healthy in greenhouse; (B, D, E) infected in plantation (courtesy AgriEngineering Journal and University of Lavras)

Comparison of the average difference in VI values and their distribution across many leaves showed that the GRNDVI index gave the best differentiation between healthy and diseased coffee leaves. Accounting for Green and Red variations between healthy and diseased leaves gave ratios of 0.32 and 0.06 for healthy and leaf miner infected leaves respectively. These values are lower than the NDVI values measured but give a much larger difference, allowing better differentiation.

Coffee farmers could benefit from quicker identification and location of leaf miner disease in their plantations if this research can be transferred to a commercial product. Coffee drinkers the world over could benefit from more sustainable farming and more stable pricing for their favourite brew.
Read the full journal paper here.

Find out about Vegetation Indexes here.

Find out more about coffee production in Brazil here.

Cassava virus infection detected with handheld multispectral imager
Healthy cassava leaves (image courtesy of Pixabay)

One of the most important sources of carbohydrate energy in equatorial countries comes from the cassava plant. It looks like a trendy house plant but the roots are large tubers that provide valuable nutrition. Tubers can be boiled and mashed or dried, ground and turned into flour. Cassava is a robust crop but suffers from two virus diseases that can ruin an entire crop with very little warning until the tubers are dug up at harvest. Rotten tubers cannot be used for food and signs of viral infection are not obvious on the leaves or stems until it is too late to plant a replacement crop. Propagation of cuttings for the following year’s crop is also affected by virus so potentially two years worth of food could be lost in a single infection.

Cassava mosaic virus (CMV) and cassava brown streak disease (CBSD) are the two main viral diseases responsible for crop loss. There are now cassava varieties that are resistant to CMV but CBSD is still problematic. There are various biochemical diagnostic tests for the diseases but the most reliable, a PCR test, is expensive, invasive and requires a relatively high level of viral load. Prompted by the need for a better, quicker test a team of researchers from University of Manchester, North Carolina State University, Rutgers University and the International Institute of Tropical Agriculture have developed a handheld multispectral leaf imager that detects the presence of CBSD before signs are obvious to the human eye.

Cassava tubers ready for processing (image courtesy of PixaBay)

In a pre-print paper last month, Hujun Yin and colleagues reported how a compact 14 wavelength multispectral leaf imaging device utilising machine learning successfully classified diseased plants and control plants. Photos of the device are shown below.

Multispectral leaf imager (a) and sample chamber window with grid to hold leaf flat and LED ring for illumination (b) (image courtesy of Creative Commons, Research Square and the authors)

The Manchester study comprised three trials, each containing cassava plants naturally immune to CMV to minimise the chance of random viral infection from another source. All three trials had three treatment groups: controls; CBSD inoculated; and E. coli inoculated. The last treatment groups were used to test the susceptibility of the inoculation method itself, E. coli should have no effect on the health of the cassava plants. Plants were measured at days 7, 14, 21, 28, 52, 59 and 88 days post inoculation (dpi). Leaf images were recorded using 14 different LED light wavelengths (395, 415, 470, 528, 532, 550, 570, 585, 590, 610, 625, 640, 660, 700 and 880 nm). At each time point plant leaves were also given scores from 1 to 4 based on how they appeared to the eye. Typical leaves are shown below.

Cassava leaf scores (1-4) at days post inoculation

In trial 2, PCR tests were performed on leaves at each time point and visual scores were documented. The visual scores showed a progression with time for the inoculated leaves as expected (see below).

Cassava leaf scores as trial 2 progressed

To verify that the virus was indeed successfully inoculated into the plants, PCR tests confirmed the virus present in some plant leaves after day 52, with the highest levels at the end of the time course.

Analysis of the leaf image spectral hypercubes (14 wavelengths x 12 random groups of leaf pixels) produced metadata consisting of six vegetation indices (VIs); average spectral intensities (ASIs) and texture (a measure of the variation of the intensities from pixel group to pixel group on a leaf). Interestingly, even some simple VIs were capable of distinguishing some diseased plants from healthy ones (more than 60% successful classification at day 52, comparable to the PCR testing).

Metadata was used to create a classifier based on measurements taken from plants with positive PCR test results. Rather than use a convolutional neural network (CNN) approach to classify the images or metadata, the team used a Support Vector Machine (SVM). SVMs have the advantage that they typically do not require high computing power and they can be intuitively quantitative using simple regression to find the best dividing lines between image categories. SVM produced a marked improvement in classification with better than 80% success as a result of using positional information in addition to VI. An introductory reference is given at the end of this post.

The group made one further improvement to their model and this was to combine subsets of classifiers produced by the SVM. They called this approach Decision Fusion (DF) and Probabilistic Decision Fusion (PDF), which is basically saying if one classifier doesn’t work, combine it with another and see if the performance improves. Finally they achieved sophisticated classification of diseased and healthy plants at day 53 and 80-90% success.

It will be very interesting to see multispectral imaging applied to more diseases and to the classification of differing diseases.

The pre-print paper can be found here, courtesy of Research Square and the authors Yao Peng, Mary Dallas, José T. Ascencio-Ibáñez, Steen Hoyer, James Legg, Linda Hanley-Bowdoin, Bruce Grieve, Hujun Yin.

A nice introduction to Support Vector Machines from MonkeyLearn can be found here.

Information on our own BACO multispectral leaf imager can be found here.

table grapes
Precision viticulture for table grapes
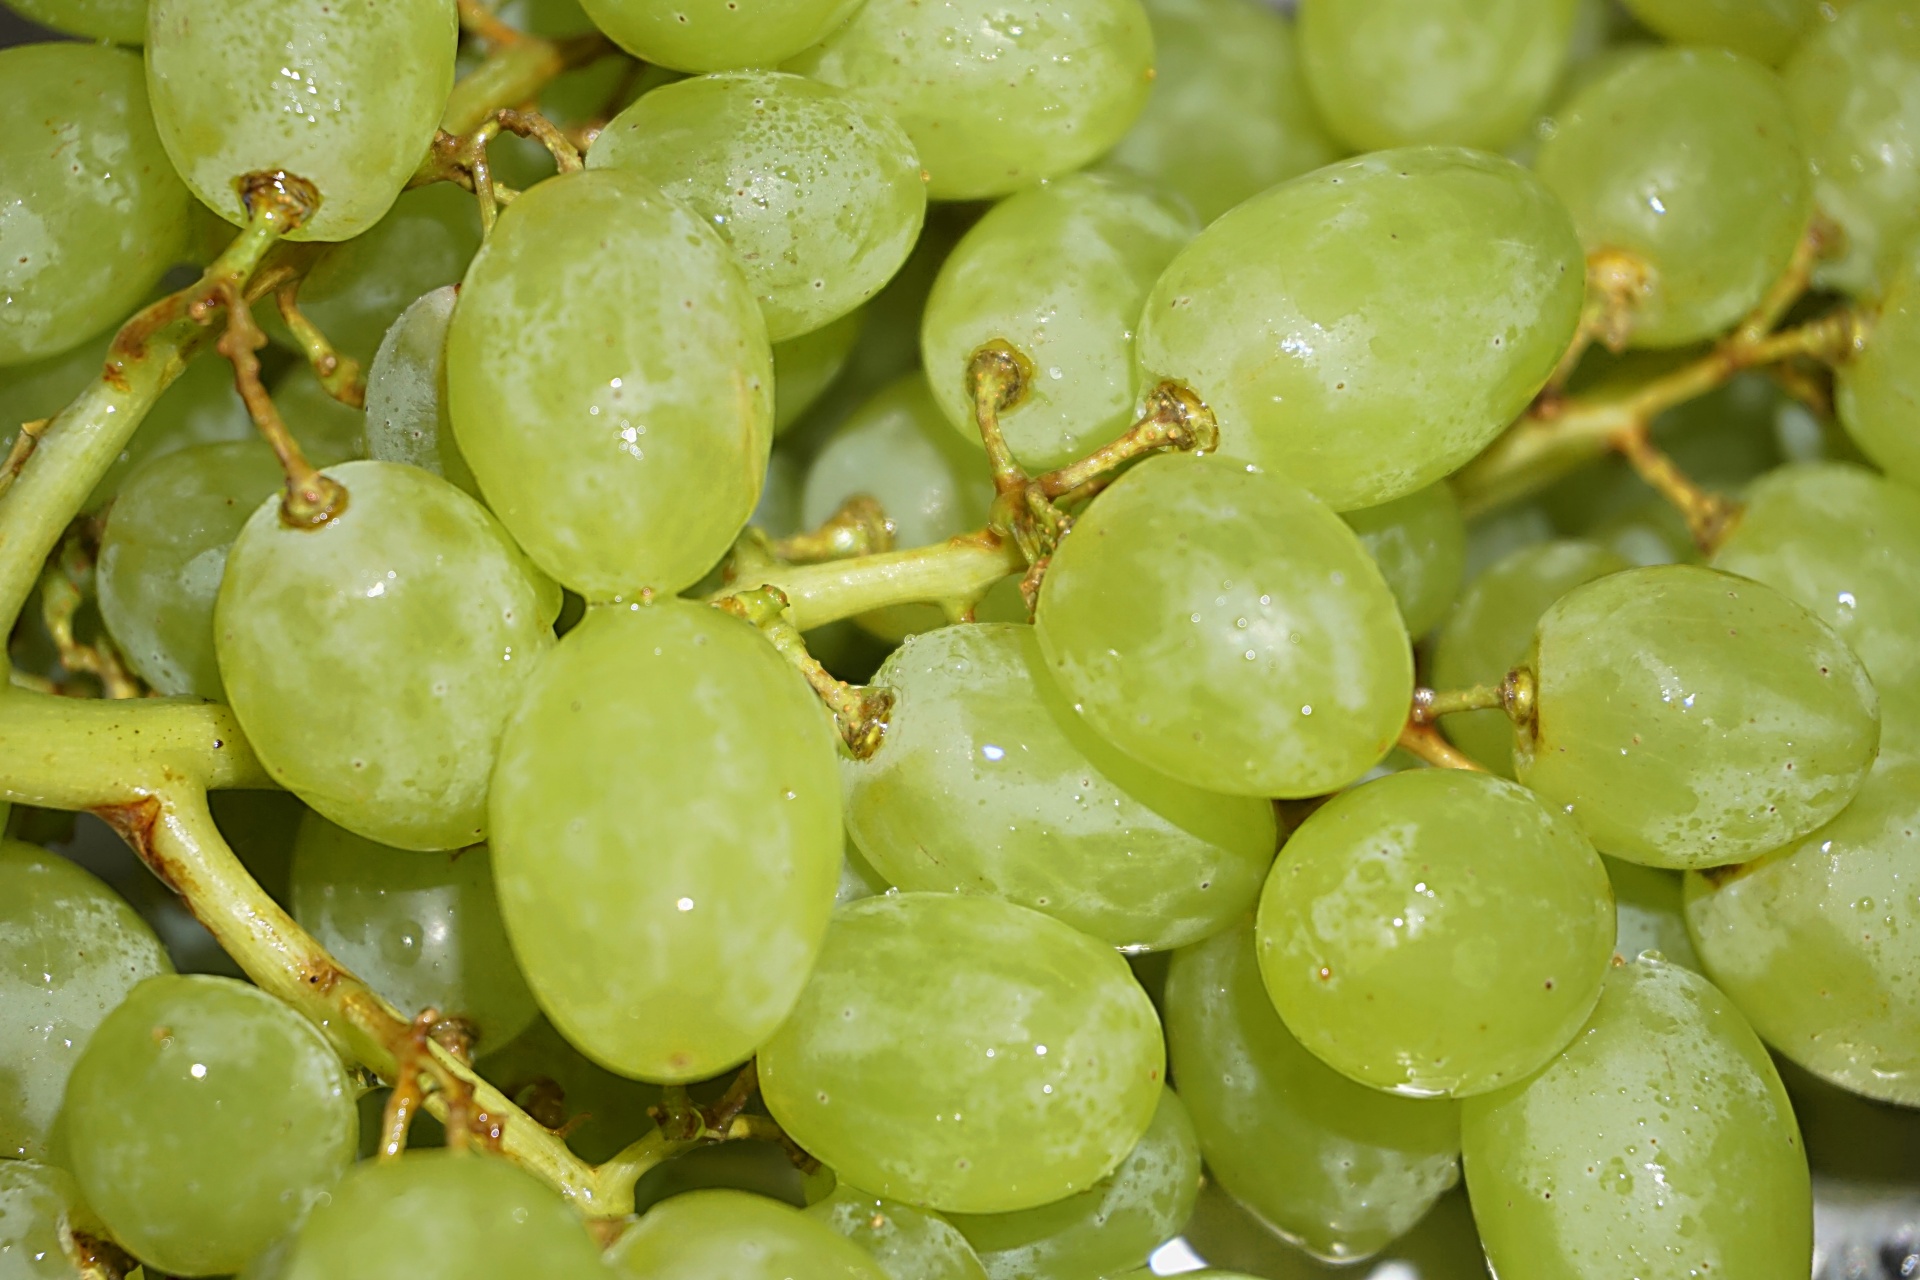
Table grapes (courtesy PublicDomainPictures.net)

Some farmers do not pick grapes, squash them and then ferment the juice. Some farmers just sell them for eating. And why not? Grapes have long been the gift of choice for hospital visitors. The glucose sugar in grapes is absorbed quickly into the blood stream to provide a burst of energy for a sick patient. Table grapes are also a major global fruit crop, with almost 26 million metric tonnes being grown last year, 2020. Typically table grapes account for roughly one third of global grape production, less than 10% are grown for dried fruit and the bulk are grown for wine making.

It is logical then that table grape growers are becoming more and more interested in new precision viticulture technologies being adopted in winery vineyards. The key questions for farmers are: which technology to adopt? what are the benefits? how easy is it to use? These are the questions a group from the Agricultural University of Athens (AUA) have been keen to answer and they recently published their findings in a paper last month.

Emmanouil Psomiadis and his colleagues from AUA made a comparison of two common approaches to vineyard monitoring: remote (via satellite) and proximal (ground based) multispectral analysis of a table grape crop canopy. Multispectral analysis measures the amount of light of different wavelengths reflected by a crop. Whereas the human eye can only see three different colour bands (red, green and blue), imaging detectors like the Multi Spectral Instrument (MSI) on the European Sentinel-2 satellite have up to 13 bands from the violet end of the visible spectrum to the invisible infrared. Having more spectral bands offers the possibility of better resolution of different plant pigments like chlorophyll, xanthophyll and lycopene. More accurate measurement of plant chemistry can potentially be used to pick up early signs of disease and nutrient deficiencies.

ESA Sentinel-2 satellite (courtesy European Space Agency)

The team from AUA were also interested to discover which of the many so-called Vegetation Indices (VIs) were the most useful. One of the features of satellite measurements of the earth surface is that the light on the ground is not always the same. It’s true that the sun’s output is pretty much constant but the angle of the sunlight falling on plants in a vineyard changes throughout the day and from season to season. The atmosphere tends to scatter blue and violet light more than red and infrared and therefore sunlight appears red in the evening and yellow in a clear sky at midday. Sunlight reflected back to an orbiting satellite from a vine canopy therefore changes from day to day.

Vegetation Indices, which are ratios of different spectral bands, were introduced to overcome these variations. Three of the most widely used are Normalise Difference Vegetation Index (NDVI), Normalised Difference Red Edge (NDRE) and Fraction of Absorbed Photosynthetically Active Radiation (FAPAR). Researchers have their own favourite VI but each tries to accurately determine the fraction of the ground covered by green vegetation within a particular image pixel.

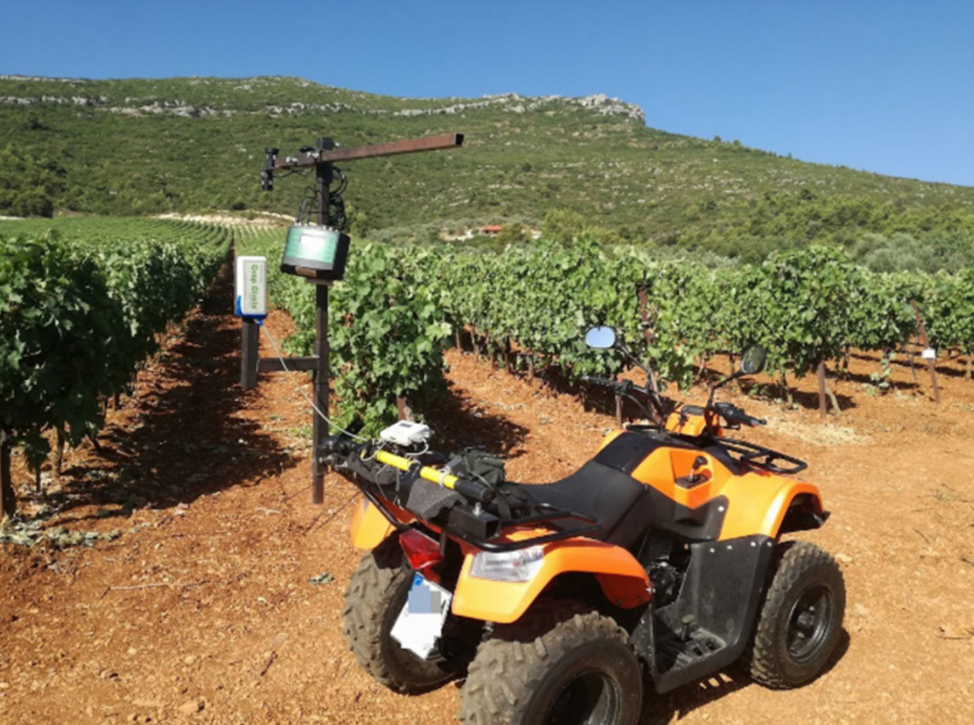
Measurements with proximal multispectral instruments have a number of advantages over satellite imaging. Handheld or tractor mounted instruments cannot cover the vast areas caught in a single frame by a satellite detector but they are never interrupted by cloud and they can be fitted with their own light sources. With a consistent light source and measuring just the vines, rather than the earth or cover crop between them, proximal multispectral imaging could offer better quality vegetation indices than satellites. The AUA group chose to use satellite data from the ESA Sentinel-2 satellite and proximal multispectral imaging from a Holland Scientific Crop Circle ACS-470 (see below mounted on a quad-bike).

Crop Circle ACS-470 on boom attached to quad-bike for multispectral measurements of vine canopy
(courtesy Agricultural University of Athens and Agronomy Journal)

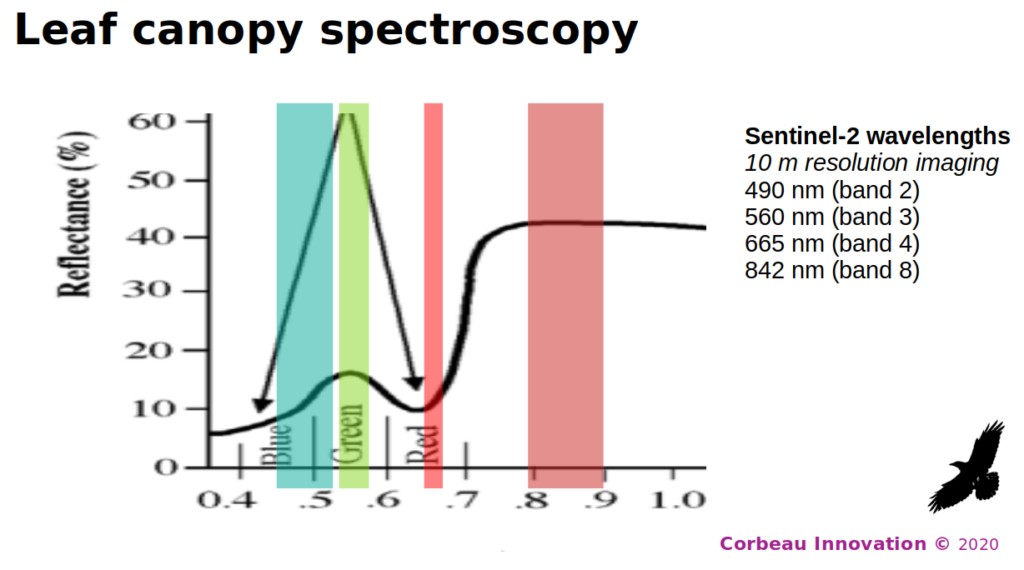
Slide showing spectral wavelength (microns)and width of Sentinel-2 detector bands and chlorophyll absorptions (arrows)

To test the ability of both proximal and remote multispectral imaging to quantify grapevine vigour (as a VI), Psomiadis and colleagues chose a small vineyard near Corinth, Greece growing table grapes. They monitored the vineyard through the season, recording proximal multispectral data from vine canopies and downloading satellite images from the start of ripening (veraison) to the point of harvest. The best correlation between the two sources of spectral measurements was obtained with NDVI and FAPAR (Fraction of Absorbed Photosynthetically Active Radiation) indices.

NDVI = (Reflectivity(Near infrared) – Reflectivity(Red)) / (Reflectivity(Near infrared) + Reflectivity(Red))

Equation for calculating NDVI; the higher the ratio, the greener the canopy

Interestingly it was found that the best correlation (correlation >0.87) between proximal and remote measurements was at the later stages of grape ripening. Sentinel-2 satellite images have at best 10m spatial resolution therefore measurements earlier in the growing season, before the full development of the leaf canopy will include a bigger contribution from bare earth or a cover crop grown between the rows of vines.

Many more details about the vineyard studied and the calculation of different VI ratios can be found in the Agronomy journal paper. Importantly, the study has shown that multispectral measurement of vineyard vegetation indices using both remote and proximal technologies give consistent results.

The paper suggests three answers to the key questions from grape farmers:

  • use either remote or proximal multispectral measurement, ideally both as they are complementary
  • the key benefit demonstrated from the study is that plant vigour can be non-invasively quantified either with low resolution satellite imaging or higher resolution proximal measurement
  • Sentinel-2 imagery is freely available but some knowledge is required to create the VI maps of a vineyard. Proximal measurement is quicker than traditional field walking but with GPS tracking it can be straightforward to relate VI ratios to vines

Read the full paper here.

Find out more about the ESA Sentinel-2 mission here.

Find out more about Corbeau’s own multispectral vineyard project.

Detection of grapevine trunk disease Esca by hyperspectral imaging
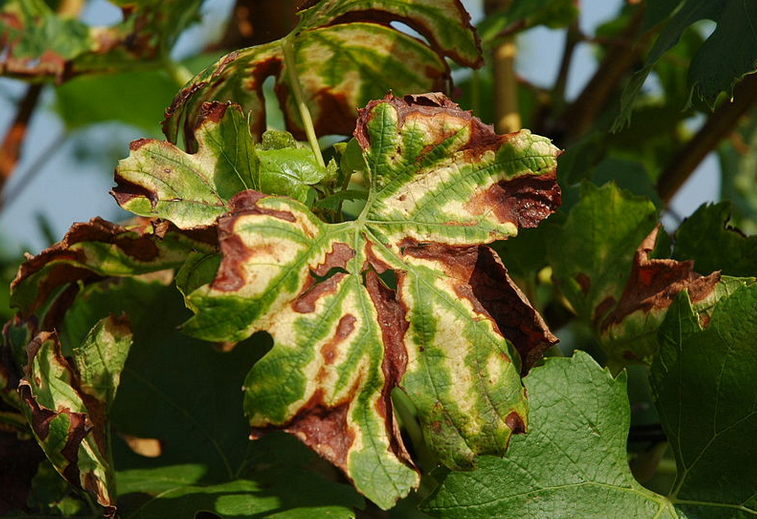
Leaves of grapevine diseased with Esca (courtesy Wikipedia)

Global viticulture loses more than £1 billion every year due to so-called grapevine trunk diseases (GTD). Some vineyards just suffer a lower yield whereas others can lose the whole vineyard. Esca is one of three main GTD diseases. Unlike the usual seasonal problems such as downy or powdery mildew, GTD have no known treatment or cure. Sodium arsenite (NaAsO2) was used in the past to control GTD but due to its wide toxicity and accumulation in the environment, its agricultural use has been banned.

One of the perplexing features of Esca is that some leaves on a vine may be affected while others appear healthy; one year a vine may look very sick with highly discoloured leaves but the next year appear healthy. Usually it is a chronic disease but can cause sudden death in just a few days with little advanced warning.

Anna Kicherer and colleagues at the Institute for Grapevine Breeding in Siebeldingen, Germany have recently reported the use of hyperspectral leaf imaging to monitor Esca in a vineyard in Germany. Writing in the journal Plant Methods they compared aerial and land-based methods of recording the reflectivity of grapevine leaves. Spectral imaging techniques have the advantage that they are non-invasive, non-destructive and can characterise crops quickly. They give what medics call a presumptive diagnosis based on the appearance of disease rather than identifying a specific pathogen with a genetic test. Nonetheless this can be very valuable as spectral imaging is quantitative, objective and contains more information than visual inspection.

As Sir Isaac Newton said, the human eye is a wonderful invention but it sees only three colours: red, green and blue. Multispectral imaging has the advantage that it sees 5-7 different colour bands from the near ultraviolet (UV) to the near infrared (NIR). Hyperspectral imaging goes further and can comprise hundreds of different colour bands from the UV (400 nm wavelength light) to NIR (1000 nm wavelength light) and infrared (IR). The Siebeldingen group therefore made a comparison of visible-NIR and IR hyperspectral imaging in the vineyard and multispectral imaging from an Unmanned Aerial Vehicle (UAV) flown over the vineyard. Small, light weight multispectral cameras can be carried by drones but heavier hyperspectral cameras need to be used on the ground. They also modelled the potential optimisation of carefully chosen hyperspectral bands to measure Esca disease in vines.

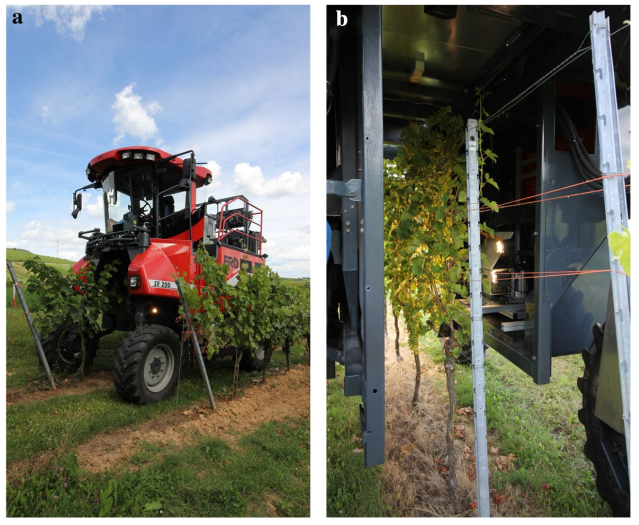
To gather the hyperspectral images of vines in a local vineyard, Kicherer and team used a modified tractor equipped with imaging cameras and GPS. The figure below shows how it was deployed in the vineyard. The tractor was equipped with additional bright light sources and spectral cameras.

The vine tractor straddling a row of vines (a) and imaging as it moves (b) (courtesy Julius Kühn-Institut and BMC Springer Nature)

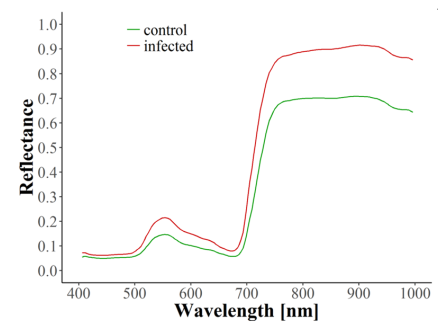
It was known at the outset that the vineyard had an incidence of around 11% Esca in the vines. Vines were imaged biweekly during the growing seasons over a three year period. Spectral imaging immediately revealed differences between healthy leaves and those affected by Esca as shown below.

Spectral reflectance of vine leaves affected by Esca and healthy controls (courtesy Julius Kühn-Institut and BMC Springer Nature)

Infected leaves clearly reflect more NIR light (700-1000 nm) and yellow to red light (550-650 nm). Much smaller changes were seen in the IR wavelength range measurements. Taking measurements from two of the three years of study, it was possible to create a machine learning model to identify vine leaves showing Esca. By adding information about which leaves came from infected vines it was possible to improve the classification of the infected and healthy vines. In the best case, using visible-NIR hyperspectral data from two years and applying the model to the third year: classification was 82% accurate, the true positive rate was 85% and the false positive rate was 14%.

Encouraged by these results, Kicherer and team tested the classification model on pre-symptomatic Esca infected vines. They reported 73-81% classification accuracy, 69-100% true positive rate and 20-26% false positive rate. Finally they beat the human eye!

Perhaps in the future vineyards will be able to use spectral imaging to eradicate Esca infected vines before infection spreads to the rest of the plants.

The Plant Methods paper also contains further information on UAV measurements and ideas for future multispectral imaging approaches. To find out more, read the Open Access document here. Further information on Esca and other GTD is available in EU sponsored YouTube videos.

Figures are reproduced courtesy of a Collective Commons licence from Julius Kühn-Institut and BMC Springer Nature.

[ratemypost]